- Bitcoin cash price found support near the $400 level and recently moved higher against the US Dollar.
- The price is trading nicely above the $410 and $420 levels, with a positive bias.
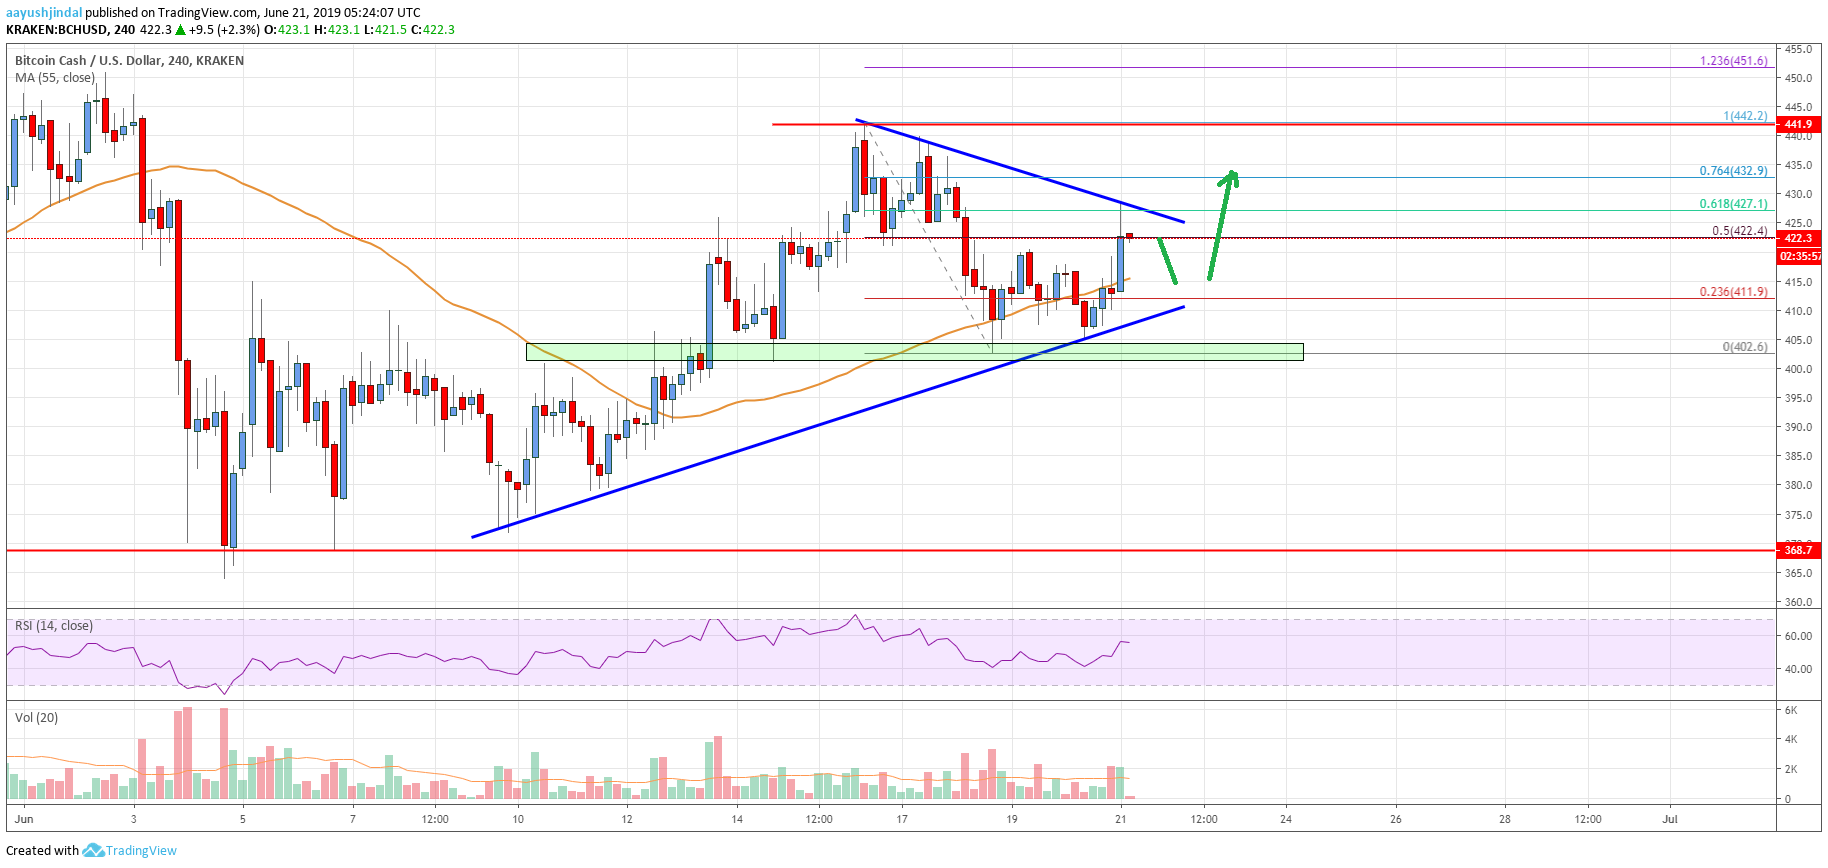
- There is a crucial bullish trend line forming with support near $410 on the 4-hours chart of the BCH/USD pair (data feed from Kraken).
- The pair is likely setting up for a major upside break above $430 and $440 in the near term.
Bitcoin cash price is trading with a positive tone above $410 against the US Dollar. BCH could start a strong upward move, considering the recent strength of bitcoin.
Bitcoin Cash Price Analysis
After topping near the $442 level, bitcoin cash price started a downside correction against the US Dollar. The BCH/USD pair traded below the $420 support level. The pair even broke the $410 level and spiked below the $405 level. However, the $400-402 area acted as a strong support and the price climbed back up. It is trading nicely above the $410 level and the 55 simple moving average (4-hours).
There was a break above the $420 level, and the 50% Fib retracement level of the last decline from the $442 high to $402 swing low. However, the price is facing resistance near the $427-430 zone. There is also a connecting bearish trend line forming with resistance at $427 on the 4-hours chart of the BCH/USD pair. The 61.8% Fib retracement level of the last decline from the $442 high to $402 swing low is also near $427.
Therefore, it there is an upside break above $427 and $430, the price is likely to climb higher in the near term. The next key resistances are near the $435 and $440 levels, above which the price could test $450.
On the downside, there is a strong support forming near the $410 level. There is also a crucial bullish trend line forming with support near $410 on the same chart. As long as the price is above the $410 support, it is likely to climb higher in the coming sessions.

Looking at the chart, bitcoin cash price is clearly trading with a positive zone above the $400 and $410 level. Besides, if bitcoin price continues to climb higher, BCH too could rally. On the upside, a clear break above the $430 and $440 levels might spark sharp gains. Conversely, a downside break below $400 could start a major drop.
Technical indicators
4 hours MACD – The MACD for BCH/USD is slowly gaining pace in the bullish zone.
4 hours RSI (Relative Strength Index) – The RSI for BCH/USD is currently well above the 50 level.
Key Support Levels – $410 and $400.
Key Resistance Levels – $430 and $440.


Leave a Reply
You must be logged in to post a comment.