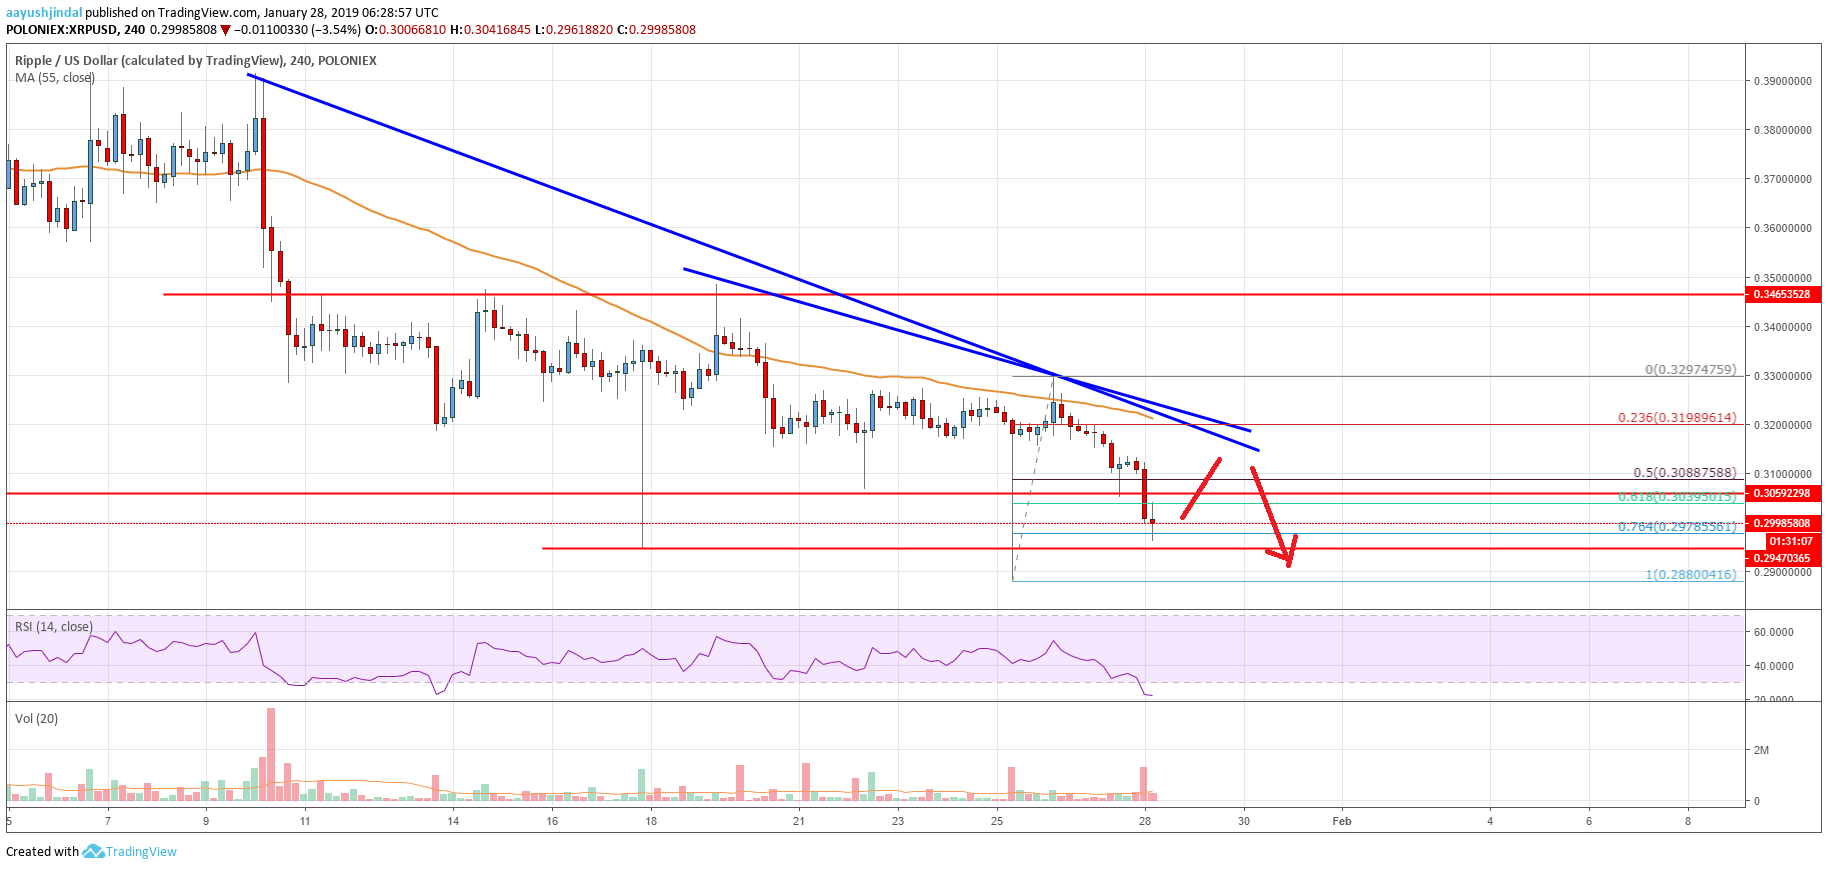
- Ripple price failed to stay above the main $0.3085 support and declined heavily against the US dollar.
- There are two major bearish trend lines formed with resistance near $0.3180 on the 4-hours chart of the XRP/USD pair (data source from Poloniex).
- The pair remains at a risk of more losses as long as it is trading below the $0.3200 pivot level.
Ripple price failed to gain strength and declined heavily below $0.3140 against the US Dollar. XRP may continue to move down and it could even break the $0.2880 swing low.
Ripple Price Analysis
In the last analysis, we discussed that ripple price remains at a risk of significant losses below $0.3140 against the US Dollar. The XRP/USD pair failed to gain strength above the $0.3200 resistance and the 55 simple moving average (4-hours). Bitcoin, Ethereum, EOS, TRX and bitcoin cash gained bearish momentum, dragging XRP below $0.3100. The price even broke the $0.3060 support level to enter a bearish zone. During the decline, the price even cleared the 61.8% Fib retracement level of the last wave from the $0.2880 low to $0.3297 high.
It opened the doors for more gains below $0.3000 and 55 simple moving average (4-hours). At the outset, the price is testing the 76.4% Fib retracement level of the last wave from the $0.2880 low to $0.3297 high. If it breaks the $0.2975 level, it could decline towards the $0.2880 swing low. More importantly, there is a risk of more losses below the $0.2880 low. The next stop could be $$0.2720 or the 1.236 Fib extension level of the last wave from the $0.2880 low to $0.3297 high. On the upside, the first resistance is near the $0.3060 level. Moreover, there are two major bearish trend lines formed with resistance near $0.3180 on the 4-hours chart of the XRP/USD pair.

Looking at the chart, ripple price is clearly at a risk of more losses unless buyers manage to surpass the $0.3200 pivot level.
Technical indicators
4-hours MACD – The MACD for XRP/USD is placed heavily in the bearish zone.
4-hours RSI (Relative Strength Index) – The RSI for XRP/USD is currently well below the 20 level.
Key Support Level – $0.2880
Key Resistance Level – $0.3200


Leave a Reply
You must be logged in to post a comment.