- Ripple price started a fresh decline from the $0.540 zone against the US dollar.
- The price is now trading below $0.500 and the 55 simple moving average (4 hours).
- There was a break below a key bullish trend line with support near $0.5100 on the 4-hour chart of the XRP/USD pair (data source from Bittrex).
- The pair could extend losses if it stays below the $0.500 resistance zone.
Ripple price is struggling below $0.500 against the US Dollar, similar to Bitcoin. XRP price must stay above $0.4400 to avoid more downsides in the near term.
Ripple Price Analysis
This past week, Ripple price attempted an upside break above the $0.5400 zone against the US Dollar. The XRP/USD pair failed to gain bullish momentum and formed a high near $0.5380.
The price declined below the $0.5000 support zone to move into a bearish zone. The bears took control and pushed the price below the $0.480 support zone. Besides, there was a break below a key bullish trend line with support near $0.5100 on the 4-hour chart of the XRP/USD pair.
It tested the $0.4400 support zone. A low is formed near $0.4403 and the price is now correcting losses. It is now trading above $0.500 and the 55 simple moving average (4 hours). There was a minor increase above the 23.6% Fib retracement level of the downward move from the $0.5382 swing high to the $0.4403 low.
On the upside, the price is facing resistance near $0.4990. It is near the 50% Fib retracement level of the downward move from the $0.5382 swing high to the $0.4403 low.
The next major resistance is near the $0.500 level. A clear move above the $0.4990 and $0.5000 resistance zones might start a fresh increase. In the stated case, the price could even surpass the $0.5200 resistance. Any more gains might send the price toward the $0.540 resistance.
Initial support on the downside is near $0.450. The next major support is near the $0.440 level. Any more losses could lead the price toward the $0.420 level, below which the price might even test $0.4000.
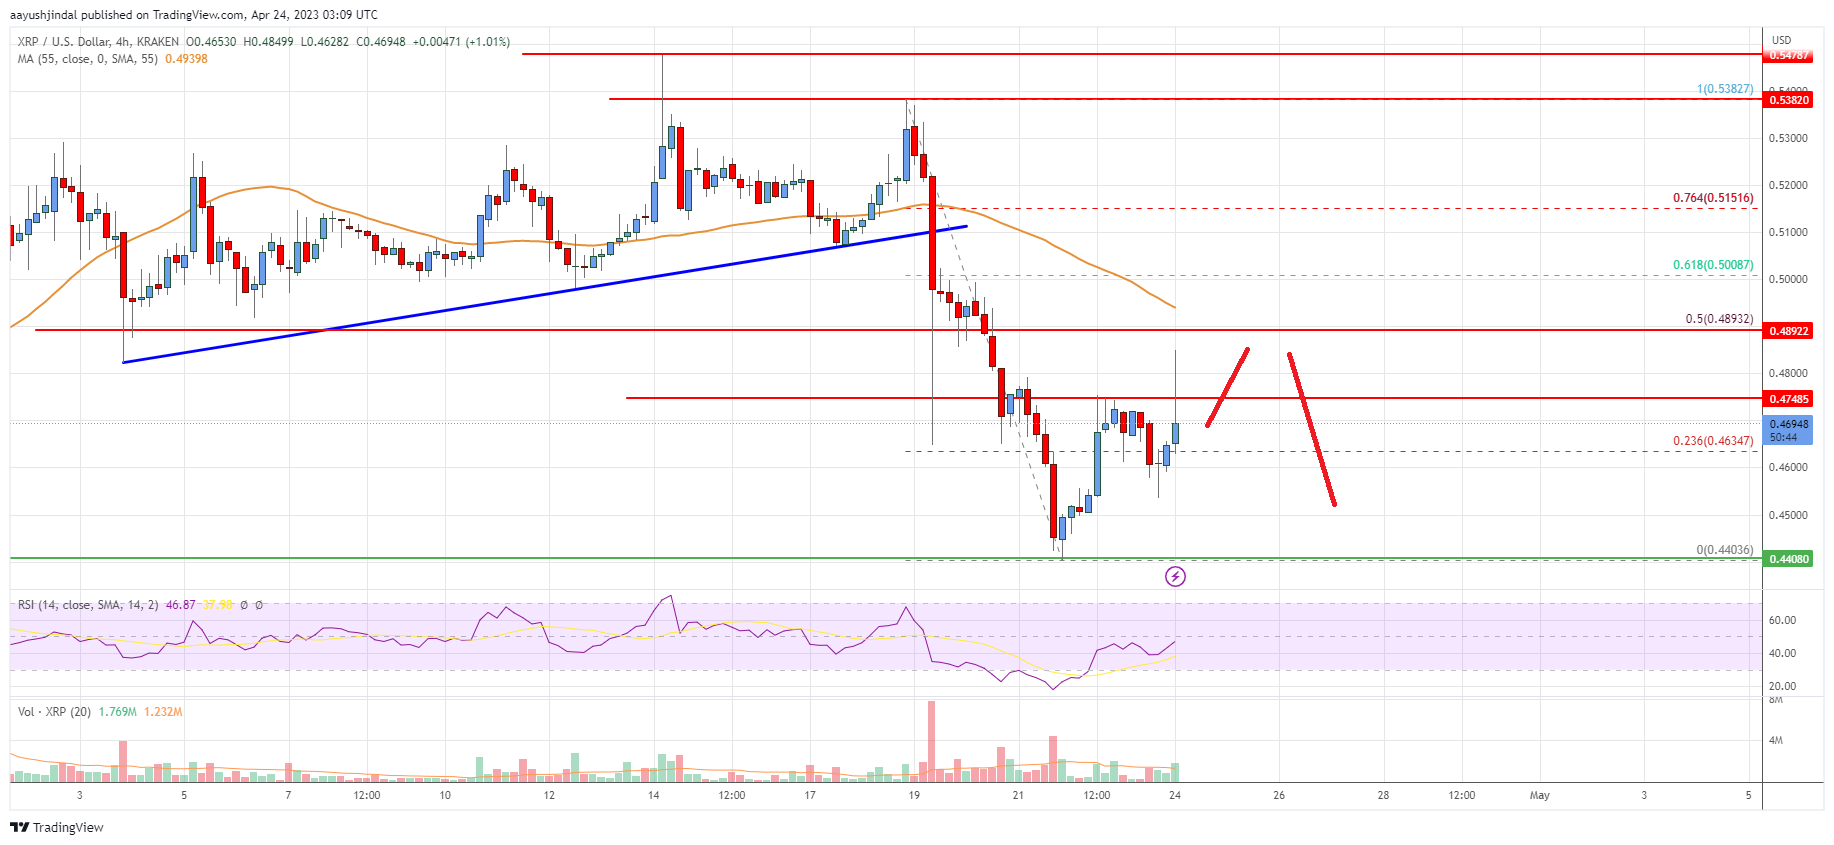
Looking at the chart, Ripple’s price is now trading below the $0.500 zone and the 55 simple moving average (4 hours). Overall, the price could extend losses if it stays below the $0.500 resistance zone.
Technical indicators
4 hours MACD – The MACD for XRP/USD is now losing momentum in the bearish zone.
4 hours RSI (Relative Strength Index) – The RSI for XRP/USD is below the 50 level.
Key Support Levels – $0.4500, $0.4400, and $0.4200.
Key Resistance Levels – $0.4990 and $0.5000.