 Emily John·September 22, 2026

Solana flashes its first SuperTrend buy signal since Oct. 10, with $96 and $121 targets watched as $60 support remains key for SOL
Solana has flashed a new bullish signal after weeks of weak price action. Traders are now watching whether SOL can extend its rebound.
The signal appeared after the ATR trailing stop moved below price. This is often used to track shifts in trend direction.
SOL was trading near $77.73 on Coinbase’s daily chart. The token remains above recent lows but still faces key resistance.
The next levels in focus are $96 and $121 if buying pressure improves. However, the $60 area remains the main support level.
Ali Charts said Solana has turned bullish after the ATR trailing stop flipped below price. ATR means Average True Range, which tracks market volatility. Traders use it to measure changing trend conditions.
SOLANA TURNED BULLISH
The ATR trailing stop has flipped below price, marking the first SuperTrend buy signal since October 10.
If buying pressure continues to build, $SOL could rally toward $96 or even $121. However, $60 remains the key level to watch.
A break below that… https://t.co/Femtlawn2r pic.twitter.com/pJSFngWZiN
— Ali Charts (@alicharts) July 15, 2026
Ali Charts said this marked the first SuperTrend buy signal since October 10. A SuperTrend signal is a trend tool based on price and volatility. It can show when buyers may be gaining short-term control.
The signal does not guarantee a rally by itself. However, it gives traders a clear level to watch. SOL now needs steady buying pressure to confirm the setup.
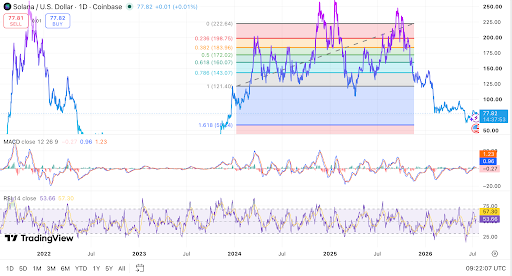
TradingView’s daily SOL/USD chart shows Solana trading near $77.73 on Coinbase. Price is holding near the $75 to $78 support area. This zone has become important after the recent rebound.
The first resistance sits between $80 and $85. A move above that range would show better buyer strength. After that, traders may watch the $90 to $100 zone.
TradingView also shows the $121.40 Fibonacci level as a major recovery area. SOL remains below that level, so the wider recovery is not confirmed. A clean move toward $121 would need several resistance breaks first.
Read also – Solana Could Surge to $127 If It Clears This Critical Resistance: Analysis
The $60 area remains the main level for the bullish outlook. A break below that zone would weaken the current setup. It could also bring the lower $58.64 chart level back into focus.
Momentum signals remain mixed despite the new buy signal. The MACD histogram is still slightly negative on the daily chart. Meanwhile, RSI is near 53.43, which is only slightly above neutral.
A move above 55 to 60 RSI would support better momentum. Until then, SOL still needs price confirmation above resistance. Traders are watching $80, $96, and $121 while keeping $60 as the invalidation level.
Related News
Explore more