
- Solana price started a fresh decline from the $34.50 resistance zone against the US Dollar.
- The price is now trading below $32 and the 55 simple moving average (4-hours).
- There is a major bearish trend line forming with resistance near $33.30 on the 4-hours chart of the SOL/USD pair (data feed from Coinbase).
- The pair could extend losses if there is a clear move below the $30.00 support zone.
Solana price is trading below $33 against the US Dollar, similar to bitcoin. SOL could accelerate further lower if it stays below the $34.50 resistance zone.
Solana (SOL) Price Analysis
SOL price made a few attempts to gain strength above the $35 resistance zone. However, the price failed to clear the $35 zone and started a fresh decline.
There was a steady decline below the $33.50 support and the 55 simple moving average (4-hours). The bears pushed the price below the $32 support zone. The pair even settled below the $32 level and is currently struggling near the $31 level.
On the downside, an initial support is near the $30.50 level. The next key support is near the $30 level. A downside break below the $30 support level might spark a major drop. In the stated case, the price may perhaps decline towards the $28 level. Any more losses might call for a test of $26.50.
On the upside, an immediate resistance is near the $32.00 level and the 55 simple moving average (4-hours). The next major resistance is near the $34.25 level. It is near the 23.6% Fib retracement level of the downward move from the $48.12 swing high to $30.01 low.
A clear move above the $34.50 and $35.00 resistance levels might call for a steady increase. The next major resistance sits near the $39.50 level. It is near the 50% Fib retracement level of the downward move from the $48.12 swing high to $30.01 low. Any more gains might send sol price towards the $42.00 resistance zone.
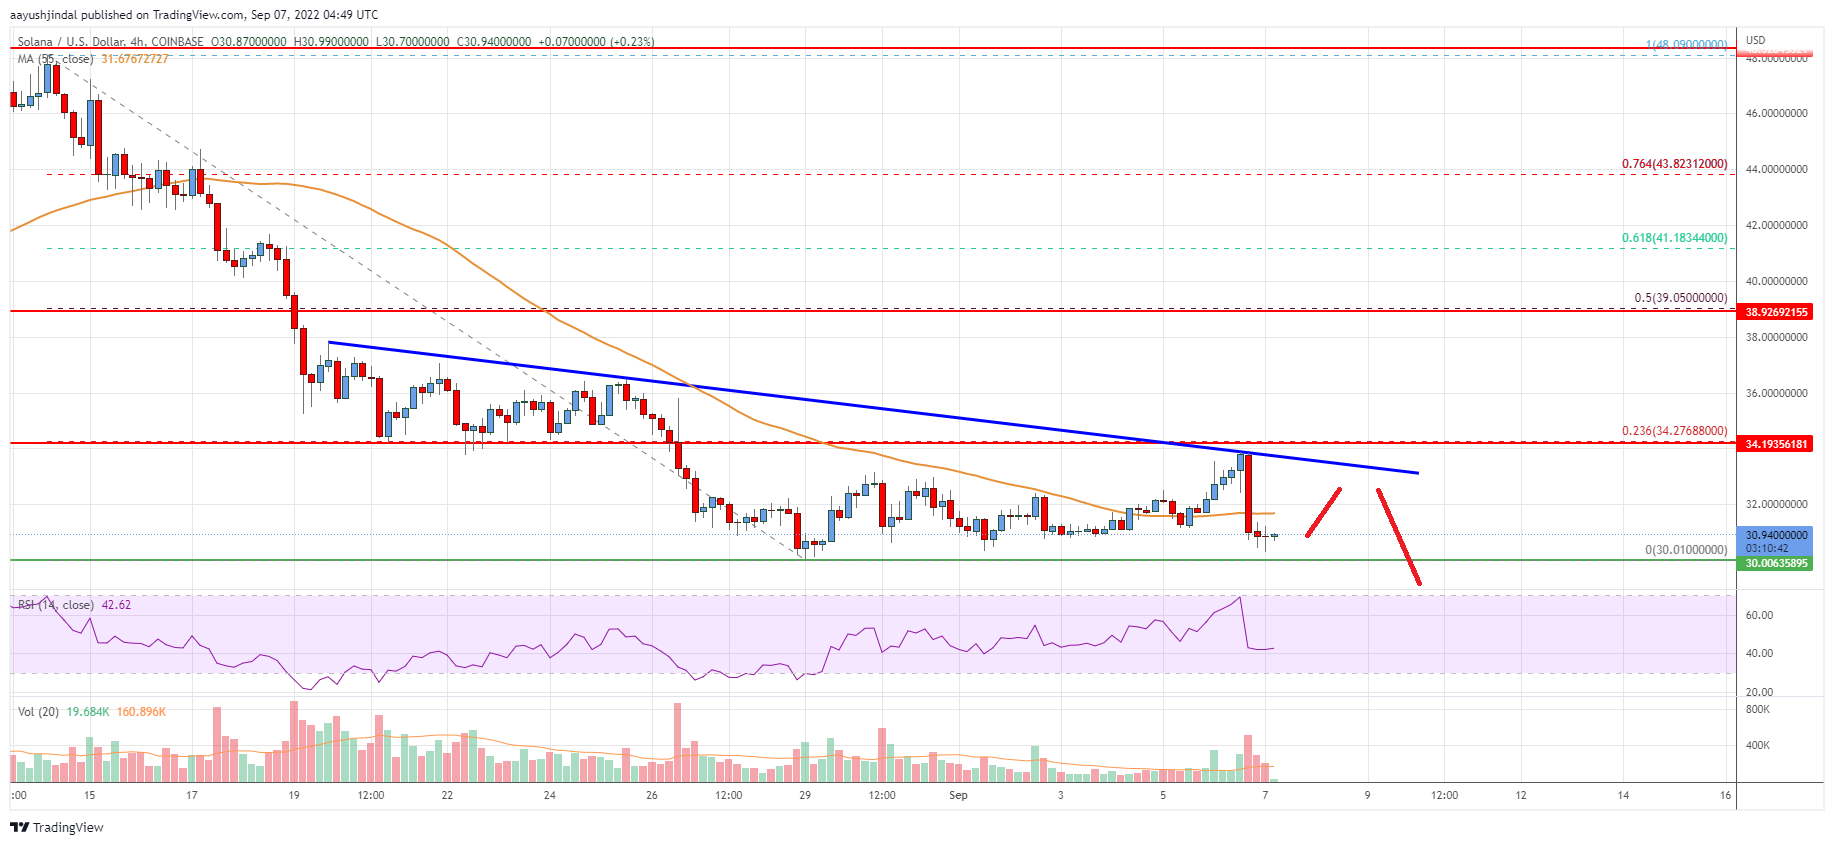
Looking at the chart, solana price is clearly trading below $33.5 and the 55 simple moving average (4-hours). Overall, the price could extend losses if there is a clear move below the $30.00 support zone.
Technical Indicators
4 hours MACD – The MACD is now gaining momentum in the bearish zone.
4 hours RSI (Relative Strength Index) – The RSI is now below the 50 level.
Key Support Levels – $30.50 and $30.00.
Key Resistance Levels – $32.00, $34.50 and $40.00.


Leave a Reply
You must be logged in to post a comment.