- Stellar lumen price started a decent increase above the $0.3500 resistance against the US Dollar.
- XLM price is now trading above $0.3700 and the 55 simple moving average (4-hours).
- There is a major contracting triangle forming with resistance near $0.3880 on the 4-hours chart (data feed via Kraken).
- The pair is likely to continue higher above the $0.3900 and $0.4000 resistance levels.
Stellar lumen price is showing positive signs above $0.3700 against the US Dollar, similar to bitcoin. XLM price could extend gains if it clears the $0.3900 and $0.4000 levels.
Stellar Lumen Price Analysis (XLM to USD)
After a close above the $0.3200 resistance zone, stellar lumen price started a fresh increase against the US Dollar. The XLM/USD pair broke the $0.3500 resistance level to move into a positive zone.
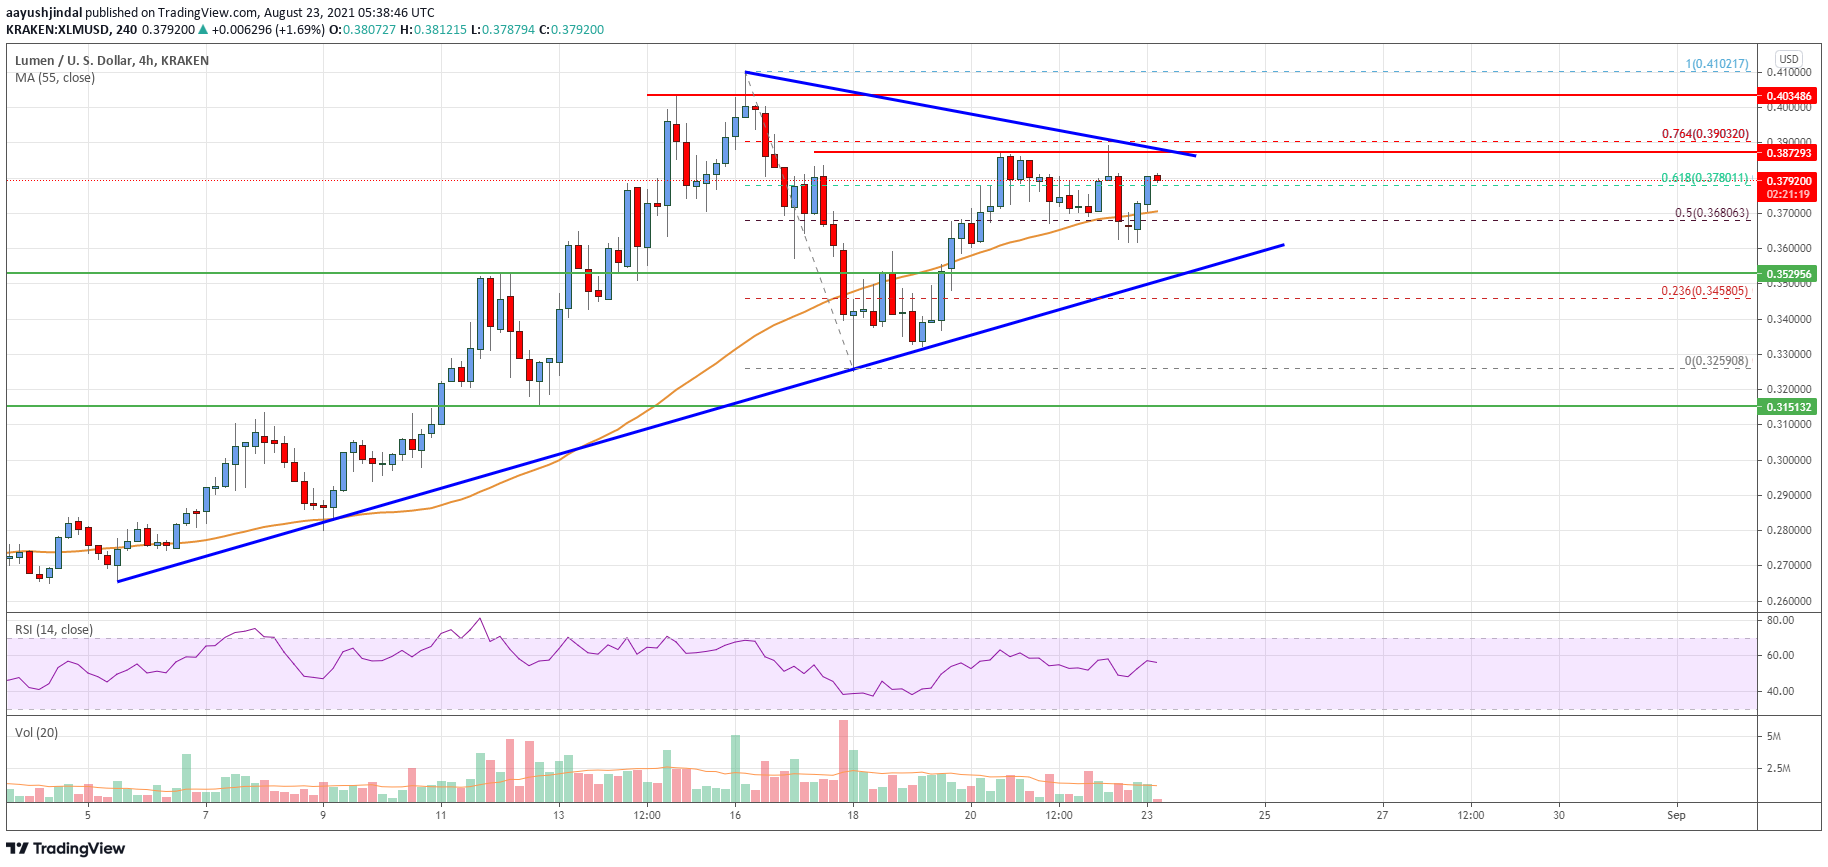
The price even rallied above the $0.4000 resistance and the 55 simple moving average (4-hours). A high was formed near $0.4102 before there was a dip below $0.3800. The bulls were active near the $0.3250 level. A low was formed near $0.3259 before the price started a fresh increase.
It broke the $0.3500 resistance zone. Besides, the price surpassed the 61.8% Fibonacci retracement level of the downward move from the $0.4102 high to $0.3259 low.
It is now trading above $0.3700 and the 55 simple moving average (4-hours). There is also a major contracting triangle forming with resistance near $0.3880 on the 4-hours chart. The triangle resistance is near the 76.4% Fibonacci retracement level of the downward move from the $0.4102 high to $0.3259 low.
If there is a clear break above the $0.3900 resistance zone, the price could start another steady increase. The next key resistance is near the $0.4000 level. Any more gains could set the pace for a larger increase in the coming sessions towards $0.4800.
On the downside, an initial support is near the $0.3700 level. The next major support is near the $0.3600 level and the triangle trend line. A downside break below the trend line support and $0.3600 might call for more losses. The next major support is near the $0.3150 zone.

The chart indicates that XLM price is now trading above $0.3700 and the 55 simple moving average (4-hours). Overall, the price is likely to continue higher above the $0.3900 and $0.4000 resistance levels.
Technical Indicators
4 hours MACD – The MACD for XLM/USD is now gaining momentum in the bullish zone.
4 hours RSI – The RSI for XLM/USD is currently above the 50 level.
Key Support Levels – $0.3700 and $0.3600.
Key Resistance Levels – $0.3900, $0.4000 and $0.4350.


Leave a Reply
You must be logged in to post a comment.