- Stellar lumen price extended its decline below the $0.4000 support against the US Dollar.
- XLM price is now trading below $0.3600 and the 55 simple moving average (4-hours).
- There is a major bearish trend line forming with resistance near $0.3600 on the 4-hours chart (data feed via Kraken).
- The pair is likely to start a steady increase if there is a break above the $0.3600 barrier.
Stellar lumen price is facing hurdles near $0.3600 and $0.3800 against the US Dollar, unlike bitcoin. XLM price could gain pace if it clears the $0.3600 and $0.3800 levels.
Stellar Lumen Price Analysis (XLM to USD)
Recently, stellar lumen price declined steadily below the $0.4500 and $0.4000 levels against the US Dollar. The XLM/USD pair even broke the $0.3500 support level.
It settled well below the $0.4000 level and the 55 simple moving average (4-hours). A low is formed near $0.3000 and the price is now correcting higher. It broke the $0.3200 and $0.3350 resistance levels. There was a break above the 23.6% Fibonacci retracement level of the downward move from the $0.4512 high to $0.3000 low.
It is now trading near the $0.3600 barrier and the 55 simple moving average (4-hours). There is also a major bearish trend line forming with resistance near $0.3600 on the 4-hours chart.
The next key resistance is near the $0.3750 level. It is near the 50% Fibonacci retracement level of the downward move from the $0.4512 high to $0.3000 low. Any more gains could open the doors for a steady increase above the $0.4000 level.
If not, the price could start a fresh decline from $0.3600. An immediate support is near the $0.3200 level. The main support is near $0.3000. Any more losses might call for a drop towards the $0.2650 support zone.
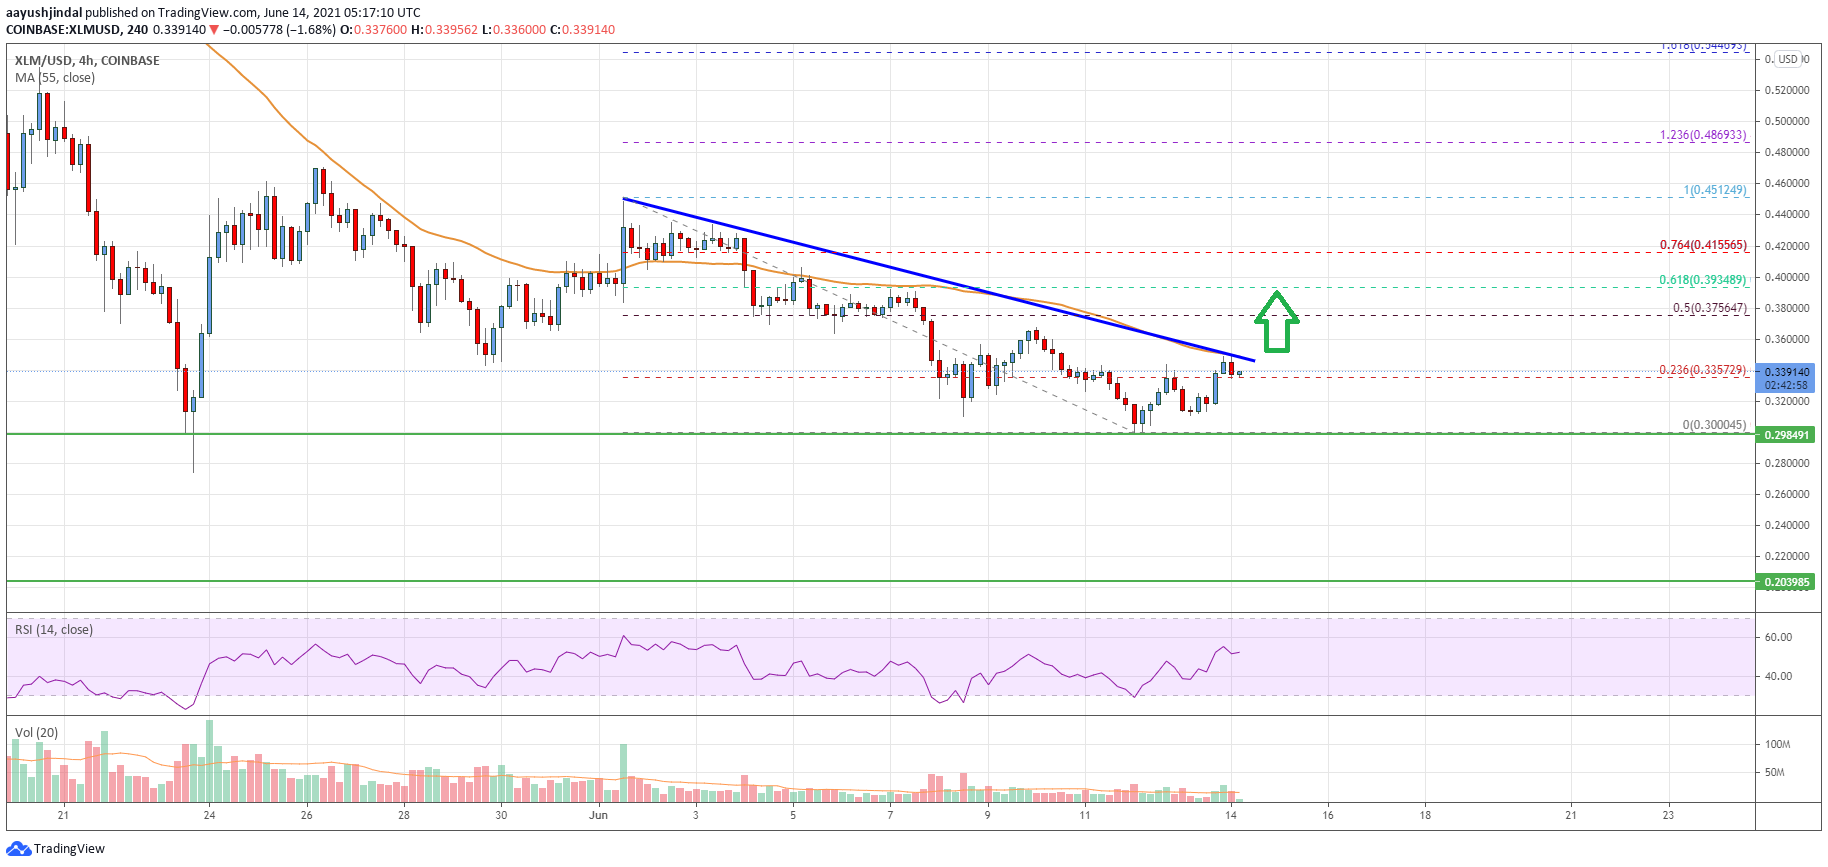
The chart indicates that XLM price is clearly trading below $0.3600 and the 55 simple moving average (4-hours). Overall, the price is likely to start a steady increase if there is a break above the $0.3600 barrier.
Technical Indicators
4 hours MACD – The MACD for XLM/USD is slowly losing momentum in the bearish zone.
4 hours RSI – The RSI for XLM/USD is currently above to the 50 level.
Key Support Levels – $0.3200 and $0.3000.
Key Resistance Levels – $0.3600, $0.3750 and $0.4000.