- Stellar lumen price struggled to clear the $0.5000 resistance zone against the US Dollar.
- XLM price is now trading below $0.4000 and the 55 simple moving average (4-hours).
- There is a key declining channel forming with resistance near $0.3740 on the 4-hours chart (data feed via Kraken).
- The pair is likely to extend its decline as long as it is below the $0.4000 pivot level.
Stellar lumen price is facing hurdles near $0.4000 and $0.5000 against the US Dollar, similar to bitcoin. XLM price could decline heavily below the $0.3500 support zone.
Stellar Lumen Price Analysis (XLM to USD)
After a strong decline, stellar lumen price found support near the $0.2750 zone against the US Dollar. The XLM/USD pair started a decent recovery wave above the $0.4000 resistance zone.
The price even climbed above $0.4500, but it faced a strong resistance near the $0.5000 level. The price topped near the $0.4750 level and the 55 simple moving average (4-hours). The price is now moving lower and trading below $0.4200.
It broke the 50% Fibonacci retracement level of the upward move from the $0.2744 swing low to $0.4740 high. There is also a key declining channel forming with resistance near $0.3740 on the 4-hours chart.
The pair is now trading below $0.4000 and the 55 simple moving average (4-hours). An immediate support is near the $0.3500 level. It is close to the 61.8% Fibonacci retracement level of the upward move from the $0.2744 swing low to $0.4740 high.
Any more losses might call for a drop towards the $0.3000 support zone. The next major support could be near the $0.2750 level.
An immediate resistance is near the $0.3800 zone. The first major resistance is near the trend line and $0.4000. A clear break above the $0.4000 level could pump the price towards the $0.4750 level. The next key resistance is near the $0.5000 level.
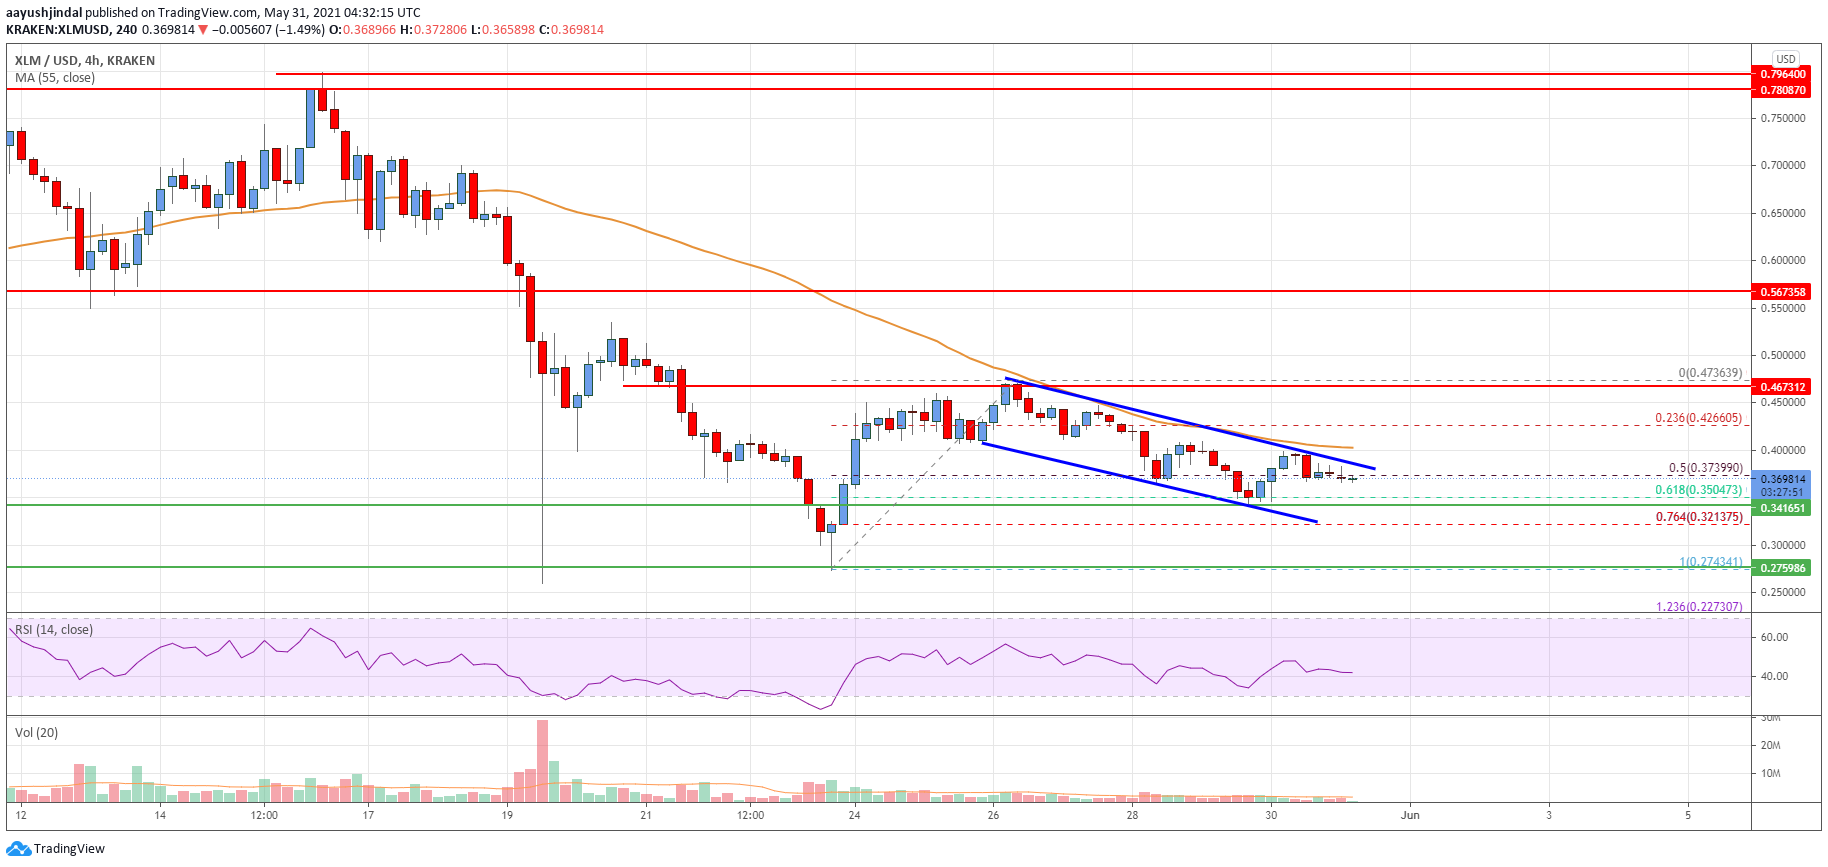
The chart indicates that XLM price is clearly trading well below $0.5000 and the 55 simple moving average (4-hours). Overall, the price is likely to extend its decline as long as it is below the $0.4000 pivot level in the near term.
Technical Indicators
4 hours MACD – The MACD for XLM/USD is slowly losing momentum in the bearish zone.
4 hours RSI – The RSI for XLM/USD is currently close to the 40 level.
Key Support Levels – $0.3500 and $0.3000.
Key Resistance Levels – $0.4000, $0.4750 and $0.5000.
