- Stellar lumen price is up more than 10% and it broke the $0.0600 resistance area against the US Dollar.
- XLM price traded to a new monthly high at $0.0661 and it is currently consolidating gains.
- There is a short term contracting triangle forming with support near $0.0610 on the 4-hours chart (data feed via Kraken).
- The pair could correct further lower towards the $0.0575 support and the 55 simple moving average (4-hours).
Stellar lumen price is showing many bullish signs against the US Dollar and bitcoin. XLM price could correct a few points, but dips remain supported near $0.0600 and $0.0575.
Stellar Lumen Price Analysis (XLM to USD)
This past week, stellar lumen price started a strong rise above the $0.0520 resistance against the US Dollar. The XLM/USD pair rallied more than 10% and broke the $0.0550 and $0.0600 resistance levels.
The price even surpassed the $0.0620 resistance and settled well above the 55 simple moving average (4-hours). A high is formed near the $0.0661 and the price recently corrected lower.
There was a break below the $0.0650 and $0.0640 levels. Besides, there was a break below the 23.6% Fibonacci retracement level of the recent rally from the $0.0489 low to $0.0661 high.
On the downside, there is a key support forming near the $0.0610 and $0.0606 levels. There is also a short term contracting triangle forming with support near $0.0610 on the 4-hours chart. The first key support is near the $0.0606 level, below which the price might extend its decline.
The next major support is near the $0.0575 level or the 50% Fibonacci retracement level of the recent rally from the $0.0489 low to $0.0661 high. Moreover, there is a connecting bullish trend line with support at $0.0560 on the same chart.
If stellar price fails to stay above the $0.0575 and $0.0560 support levels, it could move back into a bearish zone. On the upside, the price must break the triangle resistance at $0.0622 for more upsides. The next key resistance is near $0.0650, above which it could continue to rise towards the $0.0700 level.
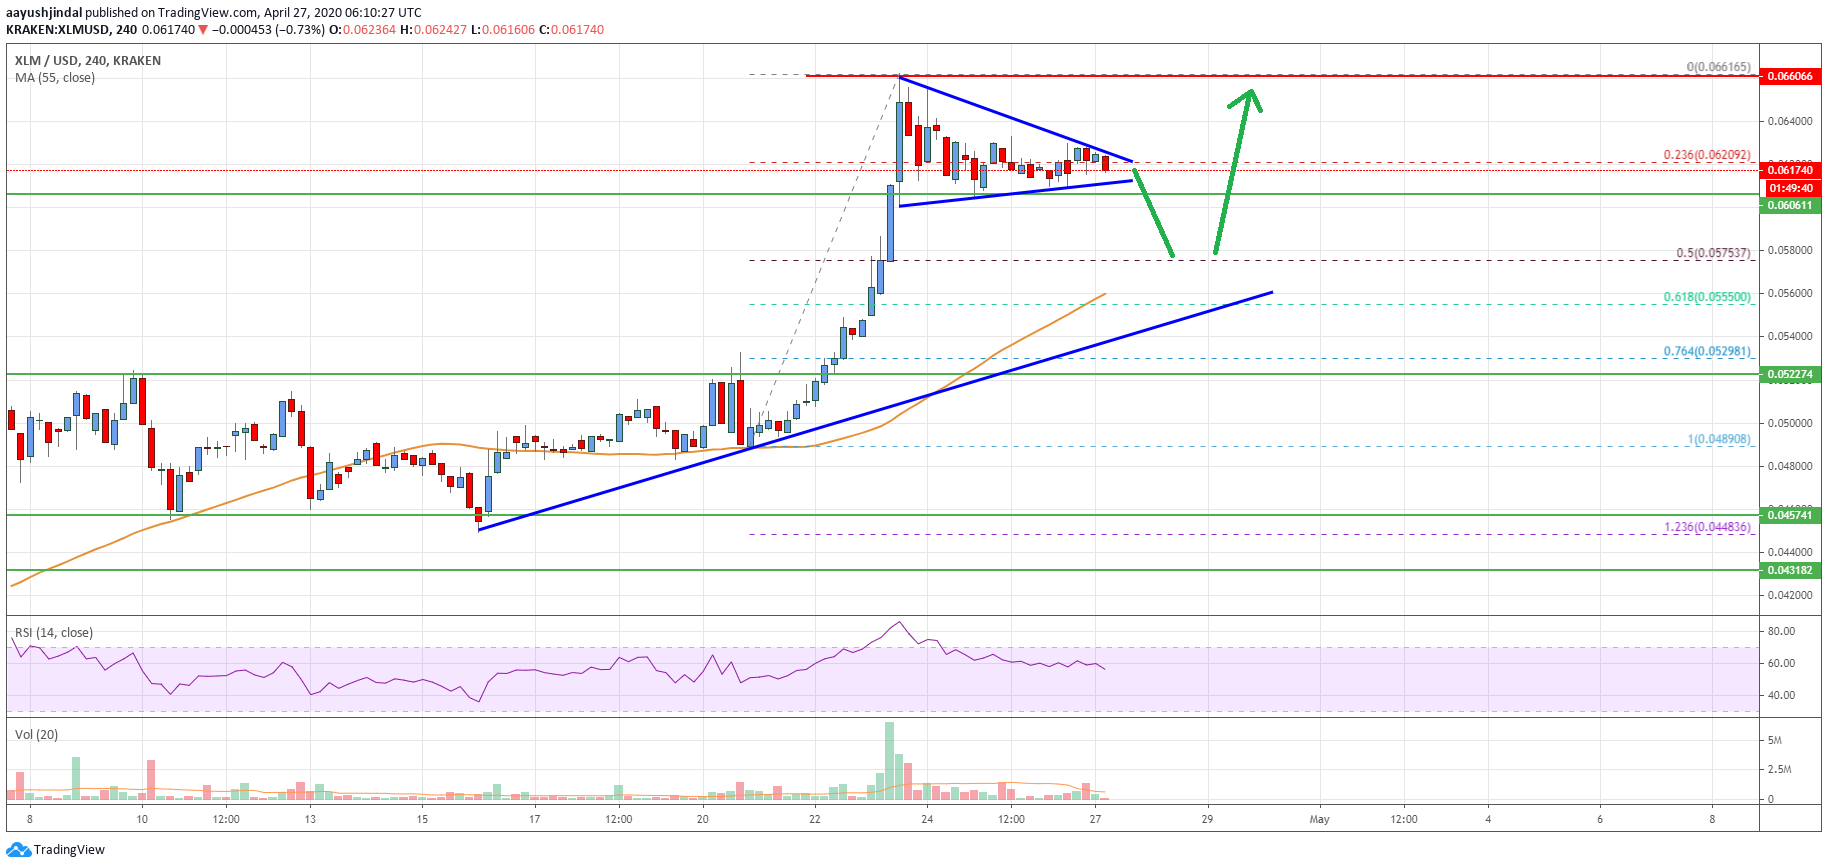
The chart indicates that XLM price is trading in a positive zone above the $0.0600 and $0.0575 levels. In the short term, the price could correct further lower towards the $0.0575 support and the 55 simple moving average (4-hours).
Technical Indicators
4 hours MACD – The MACD for XLM/USD is currently losing pace in the bullish zone.
4 hours RSI – The RSI for XLM/USD is now correcting lower towards the 50 level.
Key Support Levels – $0.0606 and $0.0575.
Key Resistance Levels – $0.0622, $0.0650 and $0.0700.


Leave a Reply
You must be logged in to post a comment.