- Stellar lumen price started an upside correction after a massive decline below $0.0400 against the US Dollar.
- XLM price is currently facing a lot of hurdles near the $0.0400 resistance area.
- There is a major bearish trend line forming with resistance near $0.0400 on the 4-hours chart (data feed via Kraken).
- The pair is likely to restart its decline if it fails to stay above the $0.0350 support area.
Stellar lumen price is showing a lot of bearish signs against the US Dollar and bitcoin. XLM price is likely to accelerate lower below the $0.0350 level in the near term.
Stellar Lumen Price Analysis (XLM to USD)
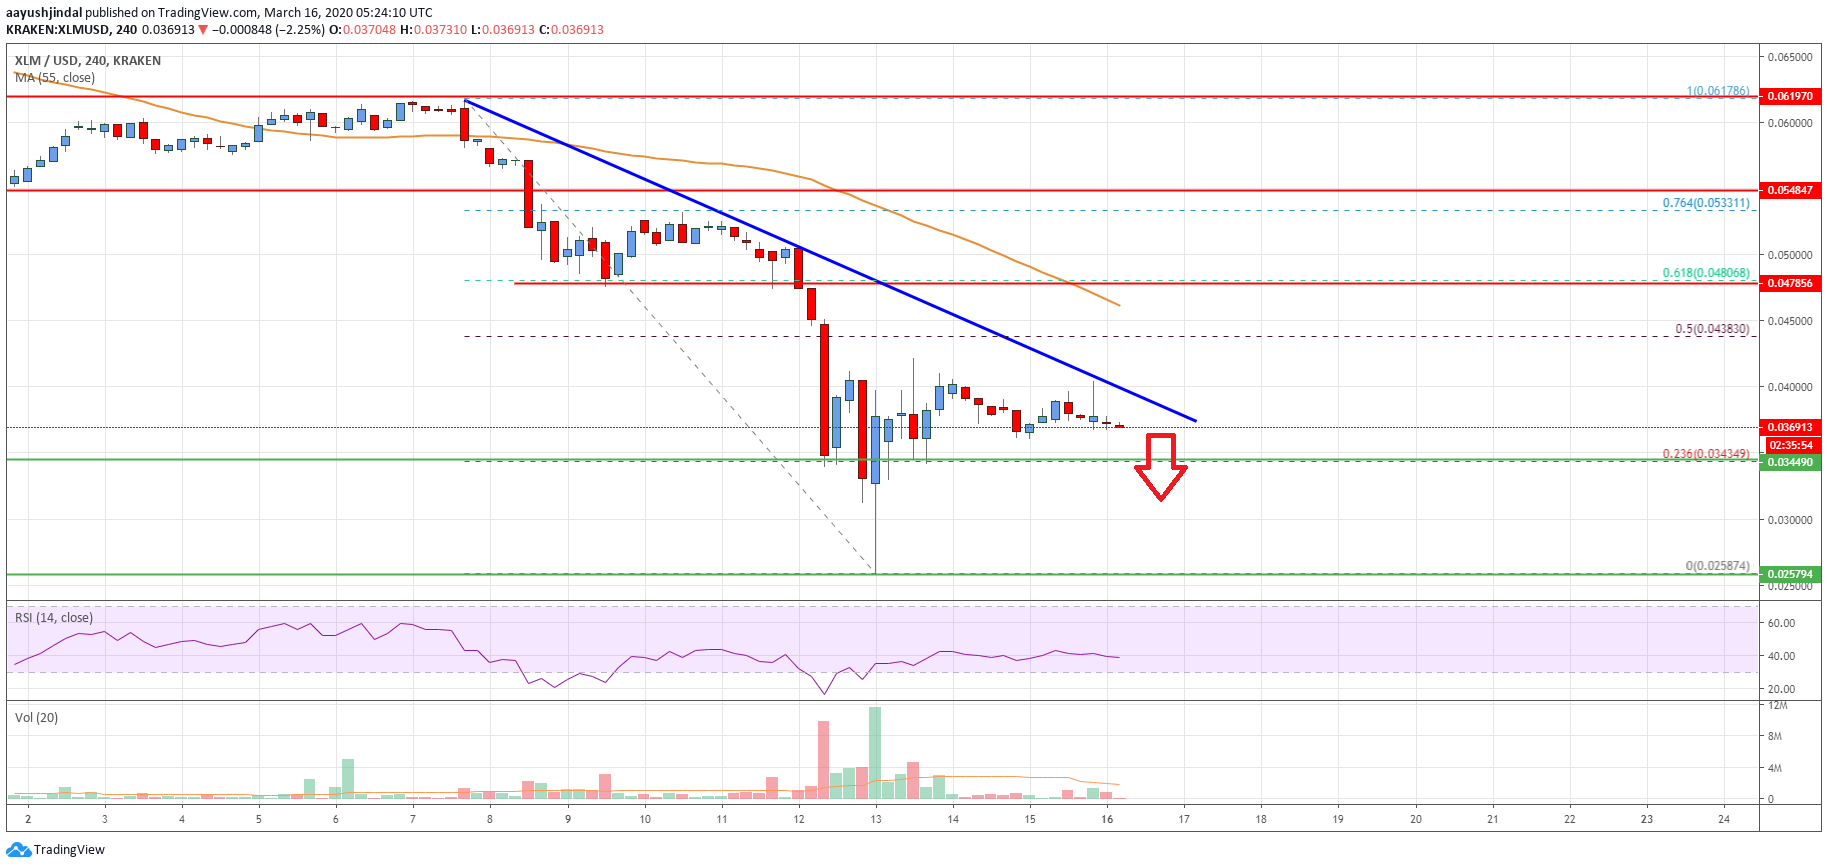
This past week, there was a massive decline in stellar lumen price below the $0.0500 support against the US Dollar. The XLM/USD pair even broke the $0.0400 support level and the 55 simple moving average (4-hours) to move into a bearish zone.
The decline was such that the price even broke the $0.0300 support area and traded to a new yearly low at $0.0258. Recently, there was an upside correction above the $0.0300 and $0.0320 levels.
Besides, there was a break above the 23.6% Fibonacci retracement level of the main drop from the $0.0617 high to $0.0258 low. However, there is a strong barrier forming near the $0.0380 and $0.0400 levels.
There is also a major bearish trend line forming with resistance near $0.0400 on the 4-hours chart. The trend line is acting as a strong barrier near the $0.0400 area.
Above the trend line, the next hurdle is seen near the $0.0435 level. It is close to the 50% Fibonacci retracement level of the main drop from the $0.0617 high to $0.0258 low. Therefore, a successful break above the $0.0400 and $0.0420 levels is needed for upside acceleration.
Conversely, the price could start a fresh decline below the $0.0360 and $0.0350 support levels. Any further losses might increase selling pressure below the $0.0320 level. In the mentioned case, the price is likely to visit the $0.0250 support level in the near term.
The chart indicates that XLM price is showing a lot of bearish signs below the $0.0380 and $0.0400 resistance levels. Therefore, there is a risk of more losses below $0.0350 and $0.0280.
Technical Indicators
4 hours MACD – The MACD for XLM/USD is currently gaining pace in the bearish zone.
4 hours RSI – The RSI for XLM/USD is now sliding below the 40 level.
Key Support Levels – $0.0350 and $0.0320.
Key Resistance Levels – $0.0400, $0.0420 and $0.0435.