
- Stellar lumen price started a fresh decline from the $0.2400 resistance zone against the US Dollar.
- XLM price is now trading below $0.2120 and the 55 simple moving average (4-hours).
- There was a break below a major bullish trend line with support near $0.2300 on the 4-hours chart (data feed via Kraken).
- The pair could continue to decline if there is a move below the $0.1950 support.
Stellar lumen price is trading in a bearish zone below $0.2120 against the US Dollar, similar to bitcoin. XLM price must stay above $0.1950 to avoid more downsides.
Stellar Lumen Price Analysis (XLM to USD)
In the past few days, stellar lumen price saw a fresh decline from the $0.2400 resistance against the US Dollar. The XLM/USD pair traded below the $0.2200 support level to enter a bearish zone.
There was a clear move below the $0.2120 level and the 55 simple moving average (4-hours). Besides, there was a break below a major bullish trend line with support near $0.2300 on the 4-hours chart. The pair even broke the $0.2000 level and settled below the 55 simple moving average (4-hours).
A low is formed near $0.1961 and the price is now consolidating losses. An immediate resistance is near the $0.2050 level. It is near the 50% Fib retracement level of the recent decline from the $0.2143 high to $0.1961 low.
The next key resistance is near the $0.2075 level. It is near the 61.8% Fib retracement level of the recent decline from the $0.2143 high to $0.1961 low. The main resistance is forming near the $0.2140 level. A close above $0.2140 could open the doors for a decent increase.
In the stated case, the price may perhaps rise towards the $0.2250 level or even $0.2300. On the downside, an initial support is near the $0.1920 level.
The next major support is near the $0.1900 level. Any more losses could lead the price towards the $0.1800 level, where the bulls might take a stand. If they fail, the price may perhaps decline towards the $0.1650 support zone.
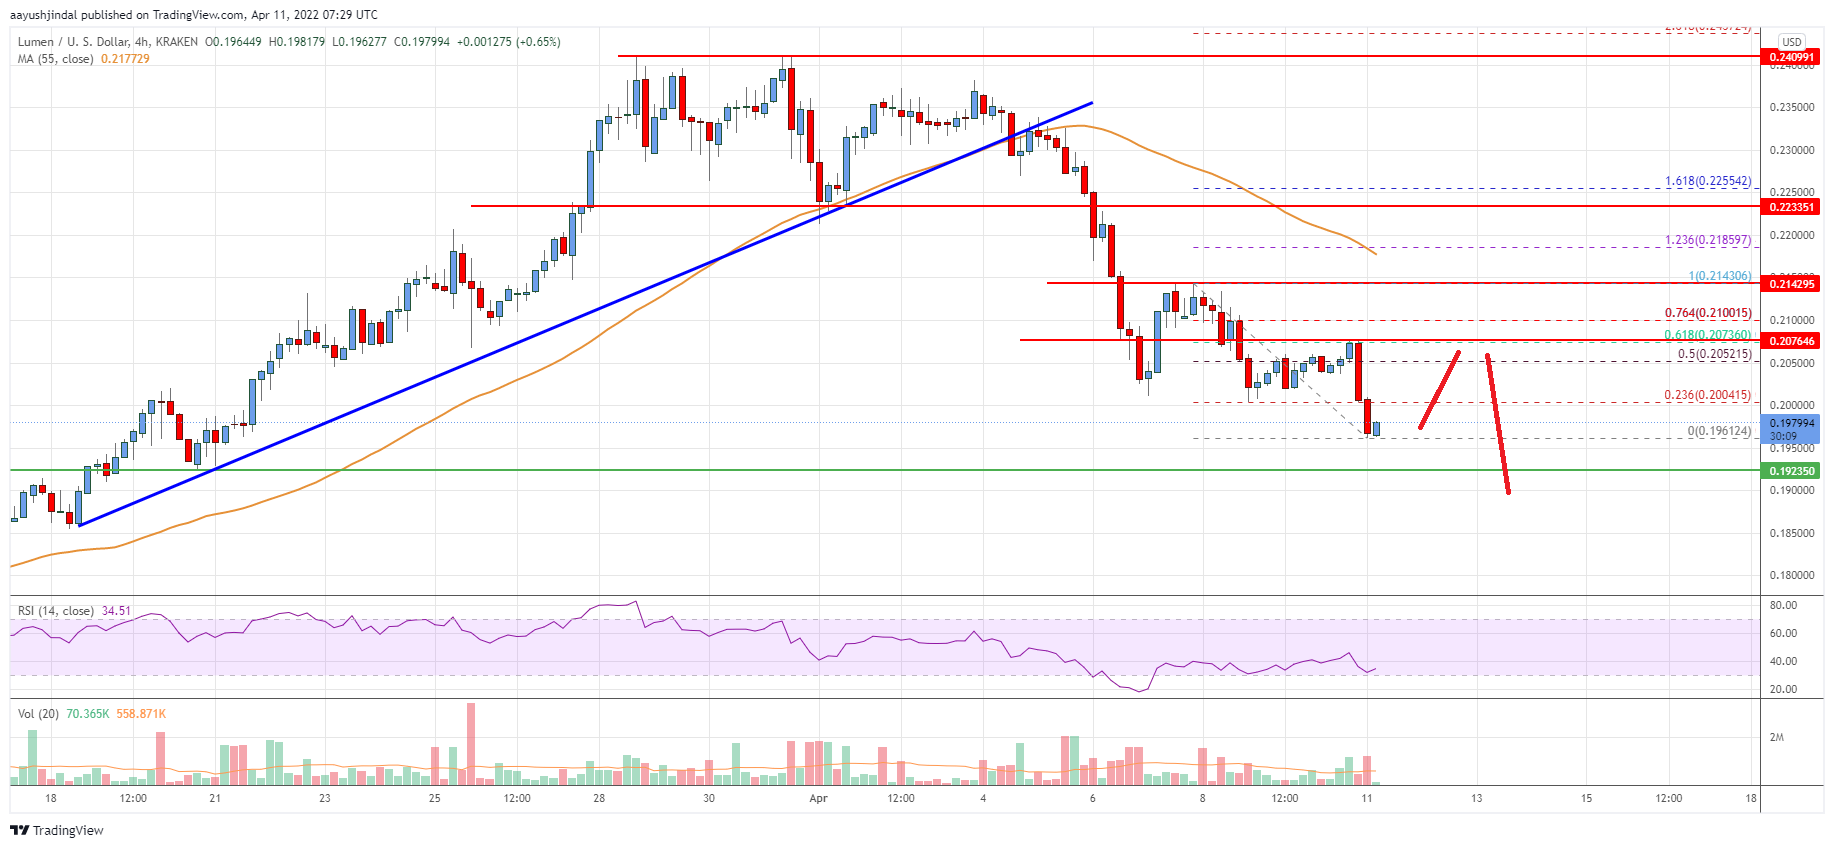
The chart indicates that XLM price is now trading below $0.2120 and the 55 simple moving average (4-hours). Overall, the price could continue to decline if there is a move below the $0.1950 support.
Technical Indicators
4 hours MACD – The MACD for XLM/USD is gaining momentum in the bearish zone.
4 hours RSI – The RSI for XLM/USD is now below the 50 level.
Key Support Levels – $0.1920 and $0.1850.
Key Resistance Levels – $0.2050, $0.2070 and $0.2140.


Leave a Reply
You must be logged in to post a comment.