- Tron price declined heavily below the $0.0135 and $0.0100 support levels against the US Dollar.
- TRX price traded as low as $0.0070 and it is currently correcting higher.
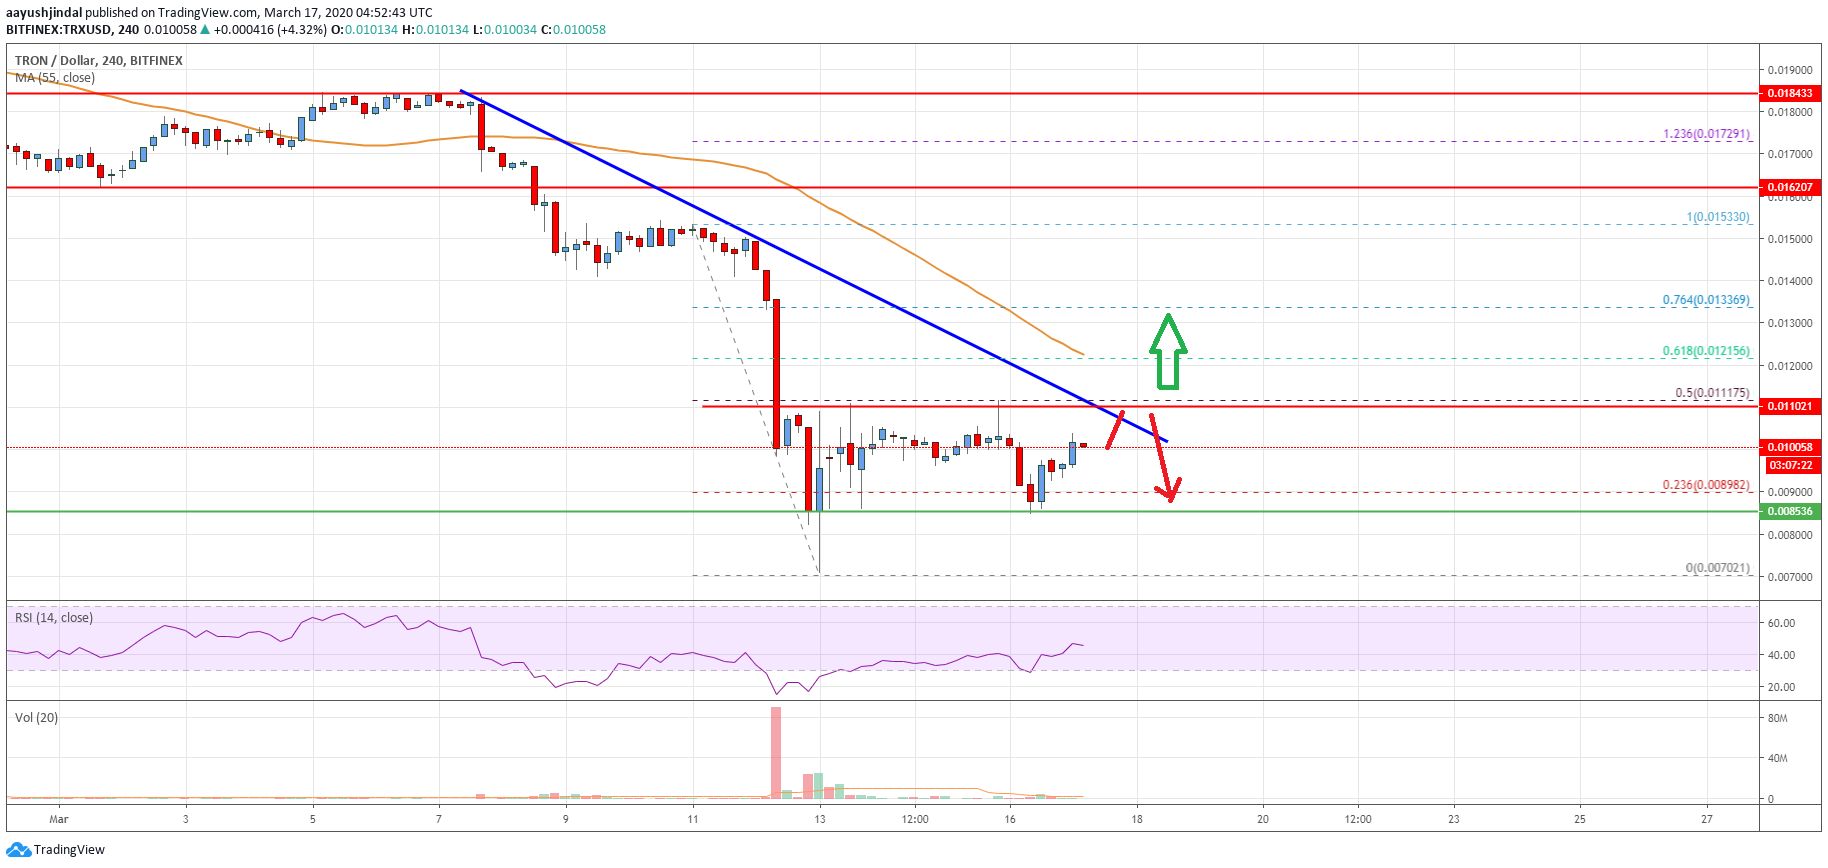
- There is a major bearish trend line forming with resistance near $0.0110 on the 4-hours chart (data feed via Bitfinex).
- The price is likely to face a strong selling interest near $0.0110 and $0.0120 in the near term.
TRON price is trading in a bearish zone below key supports against the US Dollar, similar to bitcoin. TRX price is likely to struggle as long as it is below the $0.0120 support.
Tron Price Analysis
In the past few days, there was a significant decline in TRON price below the $0.0162 support level against the US Dollar. TRX price broke many crucial supports near $0.0120 and the 55 simple moving average (4-hours) to enter a bearish zone.
The decline was such that the price even dived below the $0.0100 support area. Finally, the price traded below the $0.0880 support area and traded to a new 2020 low at $0.0070.
Recently, it started an upside correction and traded above the $0.0800 resistance level. There was a break above the 23.6% Fibonacci retracement level of the key decline from the $0.0153 high to $0.0070 low.
On the upside, there is a major resistance forming near the $0.0110 level. There is also a major bearish trend line forming with resistance near $0.0110 on the 4-hours chart. Moreover, the 50% Fibonacci retracement level of the key decline from the $0.0153 high to $0.0070 low is near the $0.0110 level to act as a hurdle.
Therefore, it won’t be easy for tron buyers to lead the price above the $0.0110 resistance level. The next major resistance is near the $0.0120 level and the 55 simple moving average (4-hours).
A successful close above the $0.0110 and $0.0120 resistance levels is needed for a trend change in the near term. Conversely, the price might struggle to gain pace above the $0.0110 resistance.
On the downside, an initial support is near the $0.0085 level, below which there is a risk of a sharp decline towards the $0.00700 level.

The chart indicates that TRX price is clearly trading in a bearish below the $0.0110 and $0.0120 resistance levels. As long as there is no recovery above $0.0120, the bears are likely to remain in control.
Technical Indicators
4 hours MACD – The MACD for TRX/USD is now slowly gaining momentum in the bullish zone.
4 hours RSI – The RSI for TRX/USD is recovering and it is approaching the 50 level.
Key Support Levels – $0.0085 and $0.0070.
Key Resistance Levels – $0.0110, $0.0120 and $0.0135.


Leave a Reply
You must be logged in to post a comment.