- Tron price started a major decline below the key $0.0280 and $0.0250 supports against the US Dollar.
- TRX price is trading with a strong bearish bias below the $0.0232 resistance area.
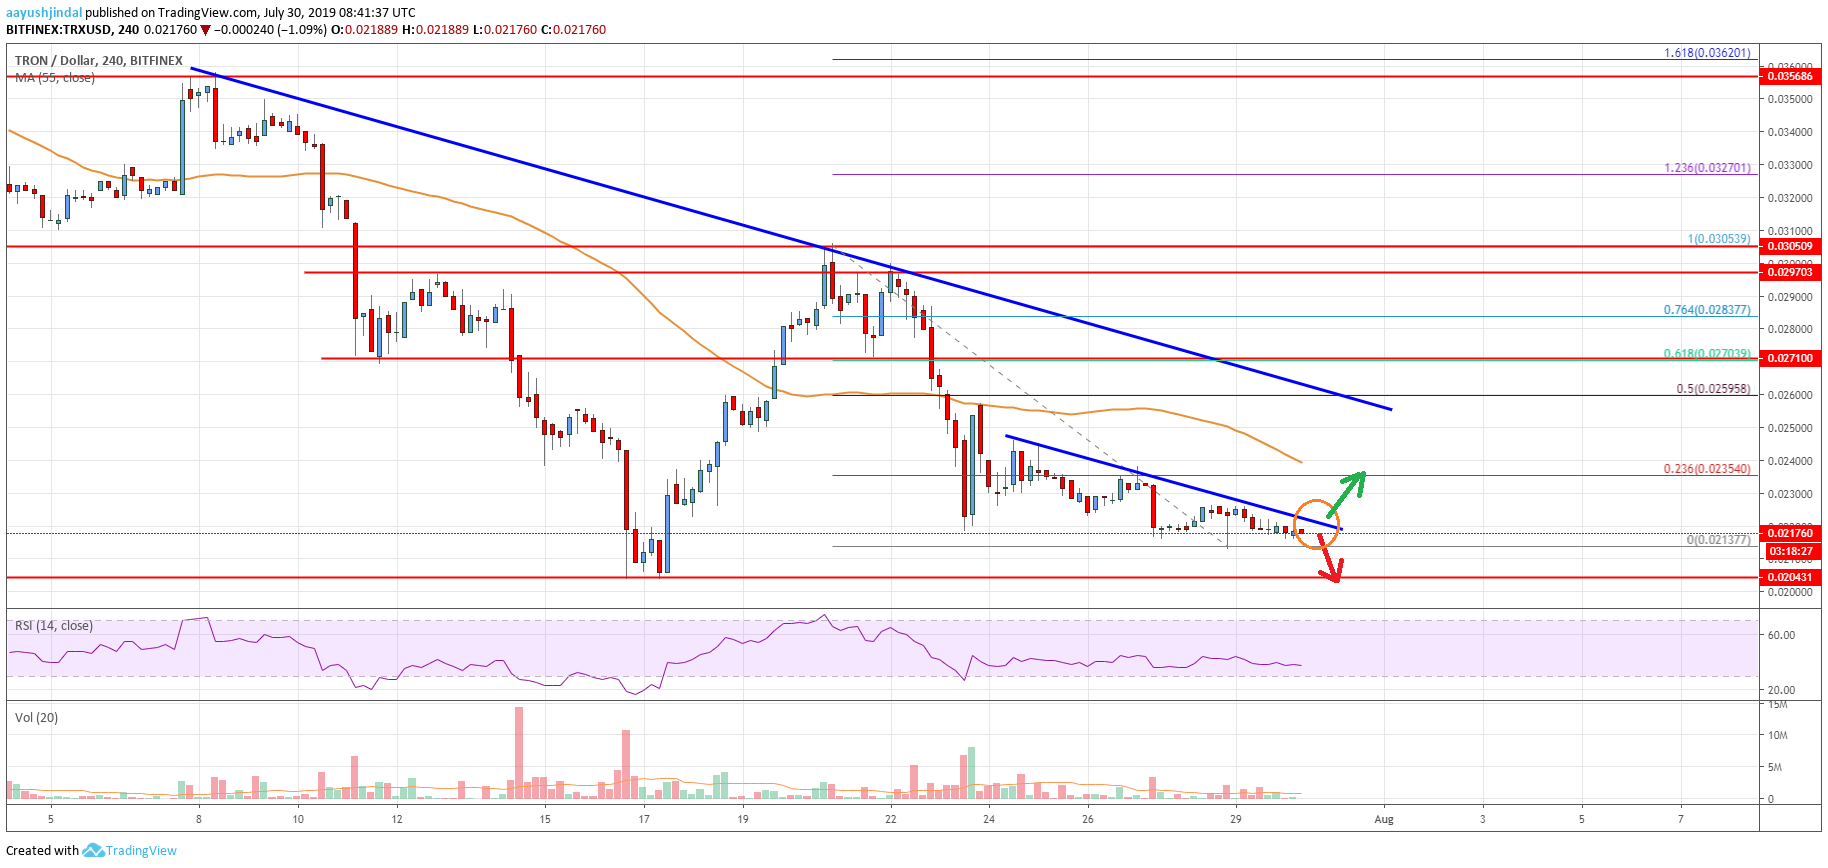
- There are two bearish trend lines forming with resistance near $0.0221 and $0.0256 on the 4-hours chart (data feed via Bitfinex).
- The price remains at a risk of more losses below the $0.0210 and $0.0200 support levels.
TRON price is facing a lot of selling interest against the US Dollar and bitcoin. TRX price could decline heavily if it fails to stay above the key $0.0200 support area.
Tron Price Analysis
After a strong rejection near $0.0305, TRON price started a major decline against the US Dollar. The TRX/USD pair broke many important supports recently, including $0.0280 and $0.0250. Moreover, there was a close below the $0.0250 support and the 55 simple moving average (4-hours). The decline was such that the price even broke the 76.4% Fibonacci retracement level of the upward wave from the $0.0204 swing low to $0.0305 high.
It opened the doors for more losses and the price even broke the $0.0220 level. A swing low was formed recently near $0.0213 and the price is currently consolidating. On the upside, there are two bearish trend lines forming with resistance near $0.0221 and $0.0256 on the 4-hours chart. Above the first trend line, the 23.6% Fibonacci retracement level of the recent slide from the $0.0305 high to $0.0213 low might act as a resistance.
The next key resistance is near the $0.0240 level and the 55 simple moving average (4-hours). To start a decent upward move, the price must break the $0.0250 resistance and the second bearish trend line. Moreover, the 50% Fibonacci retracement level of the recent slide from the $0.0305 high to $0.0213 low might also act as a resistance.
If the price fails to climb above the $0.0240 and $0.0250 resistance levels, it could continue to decline. On the downside, the main supports are near $0.0210 and $0.0204, below which there is a risk of sharp losses in the coming sessions.

The chart indicates that TRX price is clearly trading in a major downtrend below the $0.0250 pivot level. Therefore, there are chances of sharp downsides as long as the price is below the $0.0250 level. If there is a break below $0.0204 and $0.0200, the price could decline heavily towards $0.0180.
Technical Indicators
4 hours MACD – The MACD for TRX/USD is losing momentum in the bearish zone.
4 hours RSI – The RSI for TRX/USD is currently well below the 40 level and is slowly moving lower.
Key Support Levels – $0.0210 and $0.0204.
Key Resistance Levels – $0.0230, $0.0240 and $0.0250.


Leave a Reply
You must be logged in to post a comment.