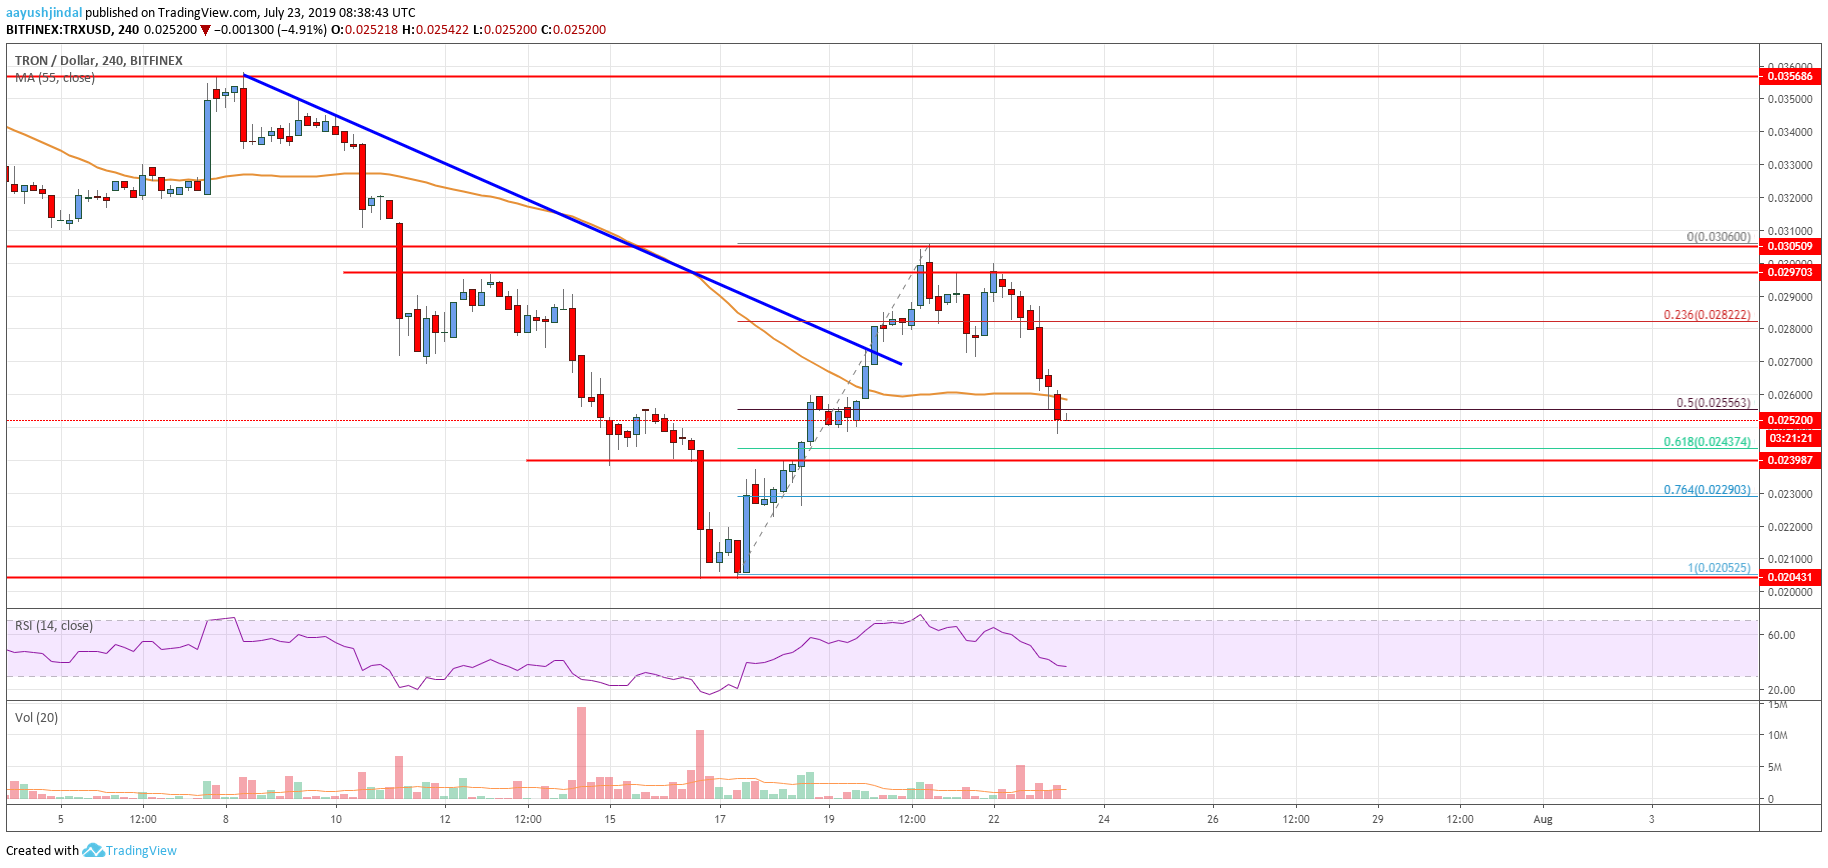
- Tron price failed to gain momentum above $0.0300 and declined recently against the US Dollar.
- TRX price traded below many supports, including $0.0285, $0.0280 and $0.0265.
- Earlier, there was a break above a key bearish trend line with resistance near $0.0280 on the 4-hours chart (data feed via Bitfinex).
- The price is now approaching a crucial support area near $0.0240, where the bulls might emerge.
TRON price is currently trading south against the US Dollar and bitcoin. TRX price is likely to test the $0.0240 support area before it could start a fresh increase.
Tron Price Analysis
After a major drop, TRON price found support near the $0.0200 level against the US Dollar. The TRX/USD pair traded as low as $0.0205 and started a fresh increase. The pair gained traction after it broke the key $0.0220 and $0.0232 resistance levels. Moreover, there was a clear break above the $0.0240 resistance level. There was even a close above the $0.0240 level and the 55 simple moving average (4-hours).
Additionally, there was a break above a key bearish trend line with resistance near $0.0280 on the 4-hours chart. Finally, there was a spike above the $0.0300 level before the bulls lost control. A swing high was formed near $0.0305 and the price recently started a strong decline. It broke the $0.0280 support and the 55 simple moving average (4-hours).
There was a break below the 50% Fibonacci retracement level of the upward move from the $0.0205 low to $0.0305 high. However, the price is now approaching a crucial support area near the $0.0240 and $0.0239 levels. Moreover, the 61.8% Fibonacci retracement level of the upward move from the $0.0205 low to $0.0305 high might also act as a support near $0.0243.
If the price fails to stay above the $0.0240 support, it could continue to move down. The next important support is near the $0.0220 level. Conversely, if the price holds the $0.0240 support, it could bounce back. An initial resistance is near the $0.0270 level. However, the main resistance is near $0.0280, above which the price could accelerate higher.

The chart indicates that TRX price is clearly under a lot of pressure below the $0.0270 and $0.0260 levels. Having said that, the $0.0240 support level is likely to act as a strong buy zone. In the short term, there could be range moves above $0.0240 before the price either starts a fresh increase or declines further to $0.0220.
Technical Indicators
4 hours MACD – The MACD for TRX/USD is gaining pace in the bearish zone.
4 hours RSI – The RSI for TRX/USD is currently well below the 50 level and is moving lower towards 30.
Key Support Levels – $0.0240 and $0.0220.
Key Resistance Levels – $0.0270, $0.0280 and $0.0300.


Leave a Reply
You must be logged in to post a comment.