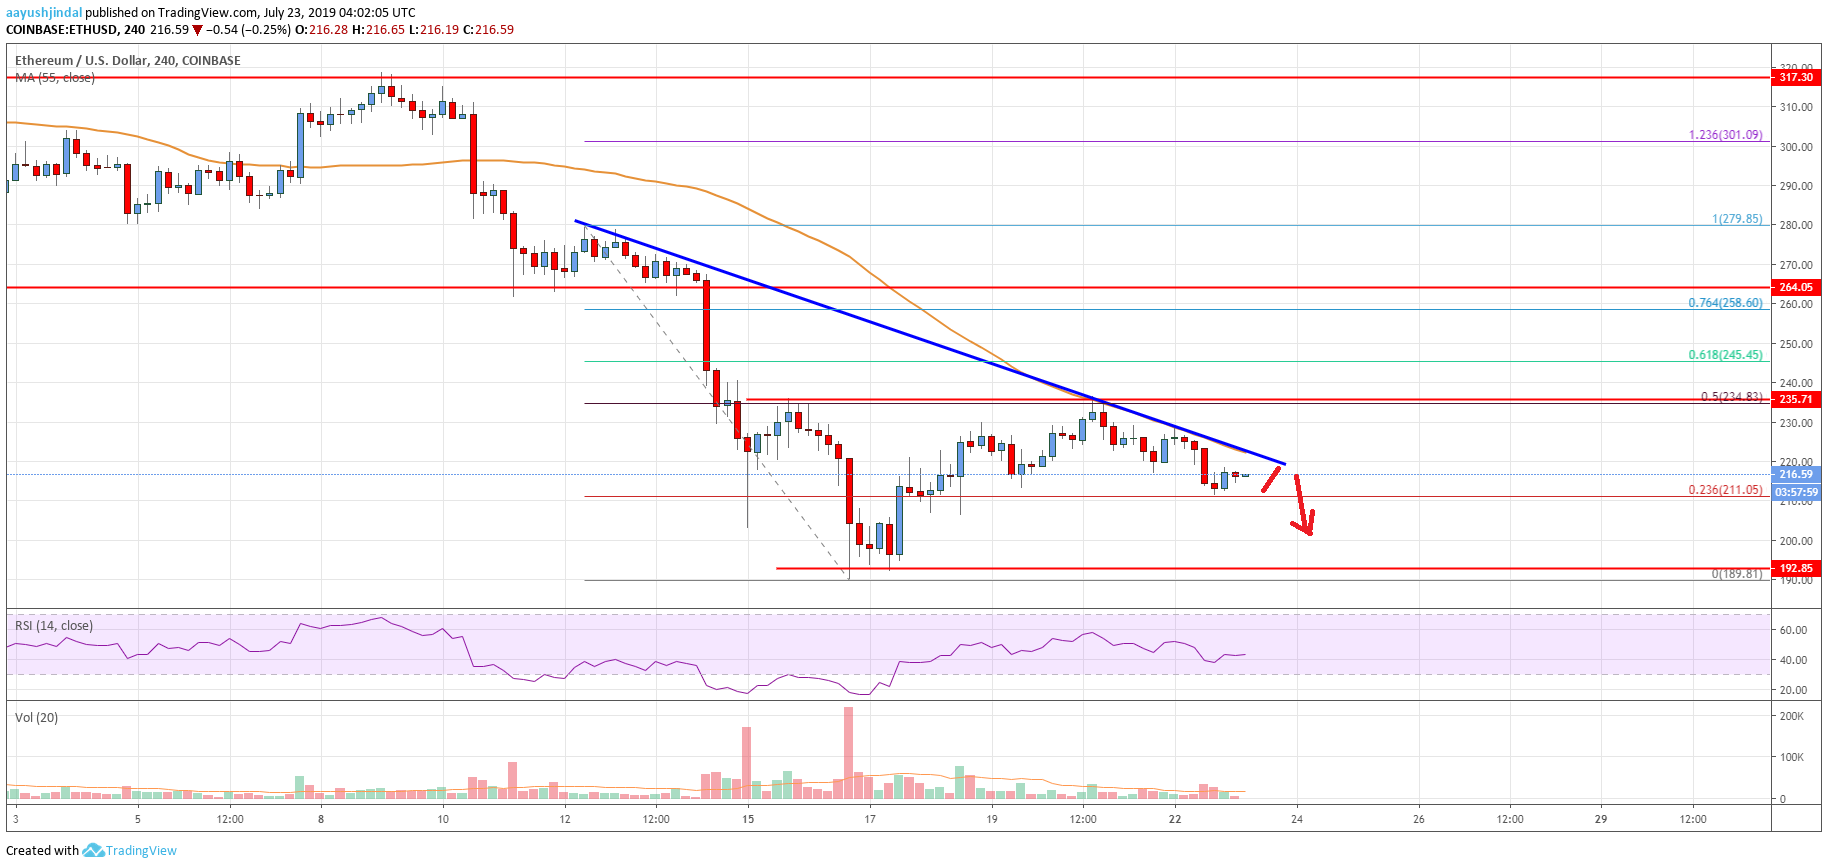
- Ethereum price failed to surpass the $234 resistance area and trimmed gains against the US Dollar.
- ETH price is now trading with a bearish angle and it is well below the $230 level.
- There is a crucial bearish trend line forming with current resistance near $221 on the 4-hours chart (data feed from Coinbase).
- The price could continue to decline unless the bulls manage to push the price above $234.
Ethereum price is showing bearish signs below $234 and $230 against the US Dollar. ETH price might continue to slide towards the $192 support level in the near term.
Ethereum Price Analysis
This past week, Ethereum price started a decent upside correction above $200 against the US Dollar. The ETH/USD pair traded above the $215 and $220 resistance levels to start the correction. The upward move was positive as the price even broke the $225 resistance level. Moreover, there was a break above the 23.6% Fib retracement level of the last drop from the $279 high to $189 low.
Finally, the price traded above the $230 level, but it faced a strong resistance near $234-235. It seems like the $234 resistance and the 55 simple moving average (4-hours) prevented more upsides. Additionally, the price was rejected near the 50% Fib retracement level of the last drop from the $279 high to $189 low. More importantly, there is a crucial bearish trend line forming with current resistance near $221 on the 4-hours chart.
At the outset, the price is trading well below the $320 level and the 55 simple moving average (4-hours). It seems to be struggling to clear the trend line and $234. Therefore, there is a risk of more losses below the $215 and $210 level. The price may perhaps break the $200 support and revisit the $192 support level in the near term.
On the flip side, the price must clear the $230 and $234 resistance levels to start a solid upward move. Moreover, a successful close above $234 and the 55 simple moving average (4-hours) is needed for a sustained upward move. The next key resistance is near the $258 and $260 levels.

Looking at the chart, Ethereum price is clearly facing a lot of hurdles near the $230 and $234 levels. As long as the price is below the $234 pivot level, there is a risk of a drop to $192.
Technical indicators
4 hours MACD – The MACD for ETH/USD is showing negative signs in the bearish zone.
4 hours RSI (Relative Strength Index) – The RSI for ETH/USD is now well below the 50 level.
Key Support Levels – $210, followed by the $192 zone.
Key Resistance Levels – $230 and $234.


Leave a Reply
You must be logged in to post a comment.