- Tron price extended its decline below the $0.0300 and $0.0280 support levels against the US Dollar.
- TRX price is now trading below the $0.0260 support and the 55 simple moving average (4-hours).
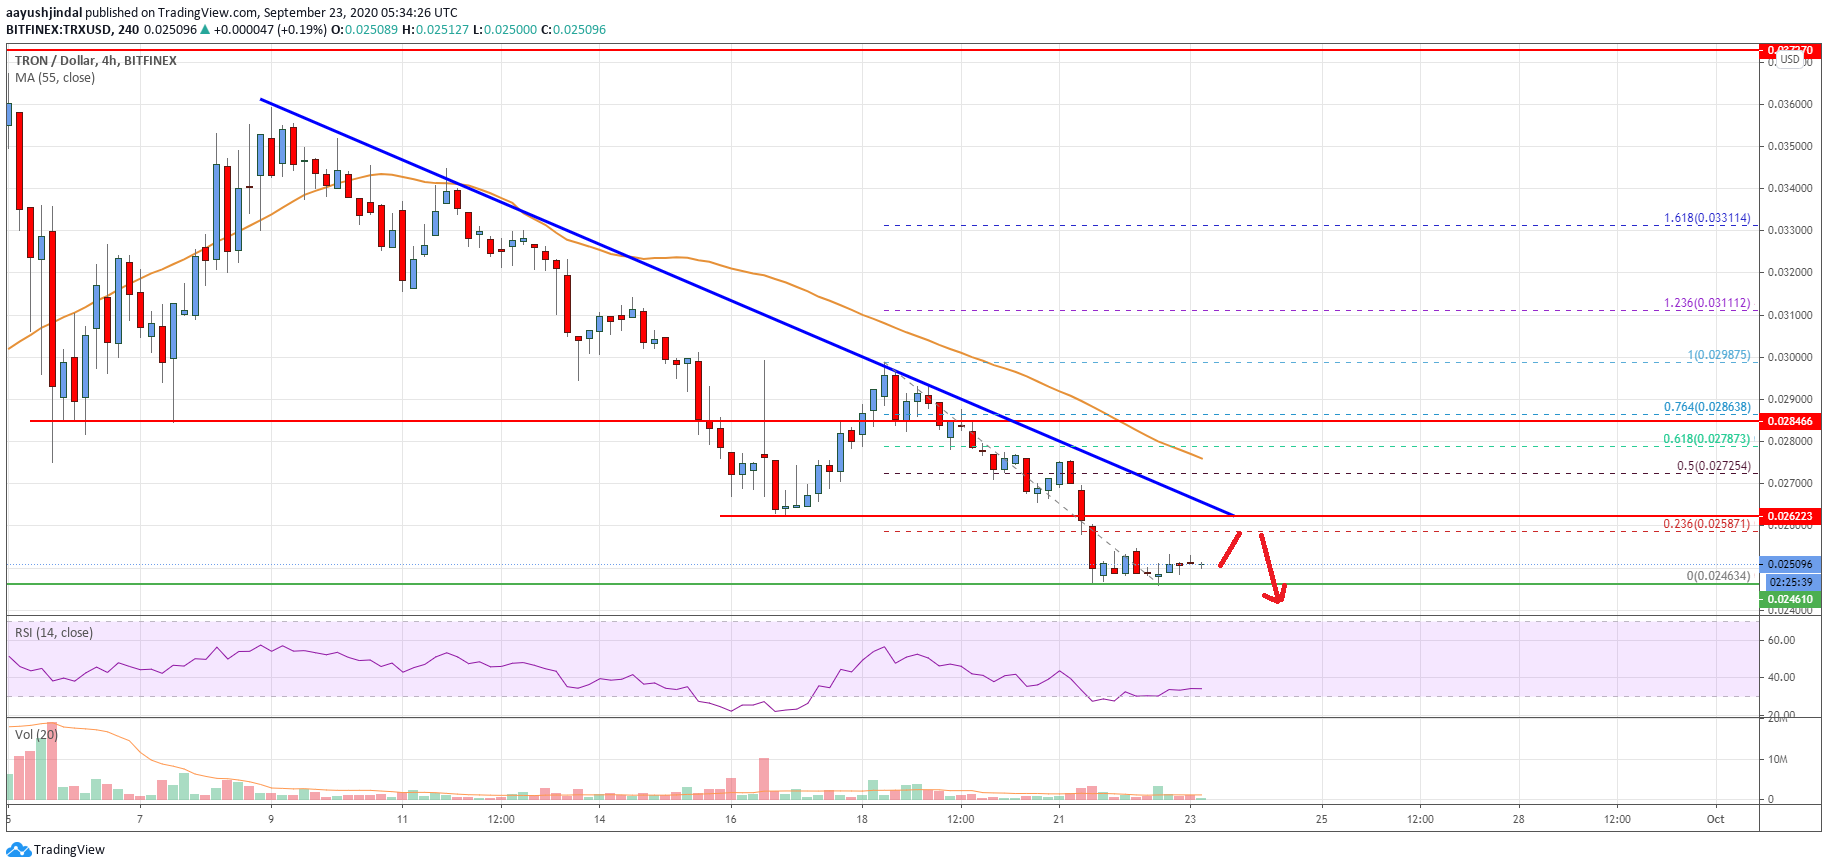
- There is a key bearish trend line forming with resistance near $0.0262 on the 4-hours chart (data feed via Bitfinex).
- The pair remains at a risk of more downsides below $0.0250 and $0.0220.
TRON price is following a bearish path against the US Dollar and bitcoin. TRX price is likely to continue lower below $0.0250 as long as it is trading below $0.0280.
Tron Price Analysis
TRON price made an attempt to clear the $0.0300 resistance, but it failed against the US Dollar. TRX price traded as high as $0.0298 and started a fresh decline below the $0.0300 and $0.0280 support levels.
The decline gained pace below the $0.0280 support and the 55 simple moving average (4-hours). It even spiked below the $0.0250 level and traded to a new monthly low at $0.0246. The price is currently consolidating losses near the $0.0250 level.
An initial resistance is near the $0.0260 level, and the 23.6% Fib retracement level of the recent decline from the $0.0298 high to $0.0246 low. There is also a key bearish trend line forming with resistance near $0.0262 on the 4-hours chart.
The next major resistance above the trend line is near the $0.0280 level. The 50% Fib retracement level of the recent decline from the $0.0298 high to $0.0246 low is also near the $0.0280 level and the 55 simple moving average (4-hours).
Therefore, a close above the $0.0280 resistance and the 55 simple moving average (4-hours is needed to start a decent recovery wave. The next major resistance is near the $0.0300 level.
If tron price fails to clear the $0.0262 and $0.0285 resistance levels, there are chances of a more losses. The main support is near the $0.0245 level. A close below the recent low and $0.0245 could lead the price towards the $0.0220 level or even $0.0200.
The chart indicates that TRX price is clearly trading below the $0.0260 support and the 55 simple moving average (4-hours). Overall, the price remains at a risk of more downsides below $0.0250 and $0.0220 in the near term.
Technical Indicators
4 hours MACD – The MACD for TRX/USD is now losing strength in the bearish zone.
4 hours RSI – The RSI for TRX/USD is currently recovering towards the 40 level.
Key Support Levels – $0.0245 and $0.0220.
Key Resistance Levels – $0.0262, $0.0280 and $0.0300.
