- Tron price started a fresh decline from well above the $0.1700 zone against the US Dollar.
- TRX price is now trading below the $0.1500 support and the 55 simple moving average (4-hours).
- There was a break below a key bullish trend line with support near $0.1420 on the 4-hours chart (data feed via Bitfinex).
- The pair could correct higher, but the bulls must gain strength above $0.1500 for more gains.
TRON price is holding the $0.1200 support zone against the US Dollar, similar to bitcoin. TRX price is now facing an uphill task near the $0.1420 and $0.1500 levels.
Tron Price Analysis
This past week, there was a steady increase in tron price above the $0.1200 and $0.1500 resistance levels against the US Dollar. TRX price even climbed above the $0.1650 level and 55 simple moving average (4-hours).
However, the bulls faced a strong resistance near the $0.1800 zone. A new multi-week high was formed near $0.1801 before the price started a sharp decline. There was a break below the $0.1650 and $0.1500 support levels.
There was also a break below a key bullish trend line with support near $0.1420 on the 4-hours chart. TRX is now trading below the $0.1500 support and the 55 simple moving average (4-hours). A low is formed near $0.1178 and the price is currently correcting higher.
It cleared the 23.6% Fib retracement level of the recent decline from the $0.1801 high to $0.1178 low. An initial resistance on the upside is near the $0.1420 level and the 55 simple moving average (4-hours).
The main resistance is now forming near the $0.1500 level. It is near the 50% Fib retracement level of the recent decline from the $0.1801 high to $0.1178 low. A clear break above the $0.1450 and $0.1500 levels may possibly start a strong increase in the coming sessions.
Conversely, there might be a fresh decline below the $0.1250 level. The next major support is near the $0.1200 level. Any more losses might call for a test of the $0.1050 level.
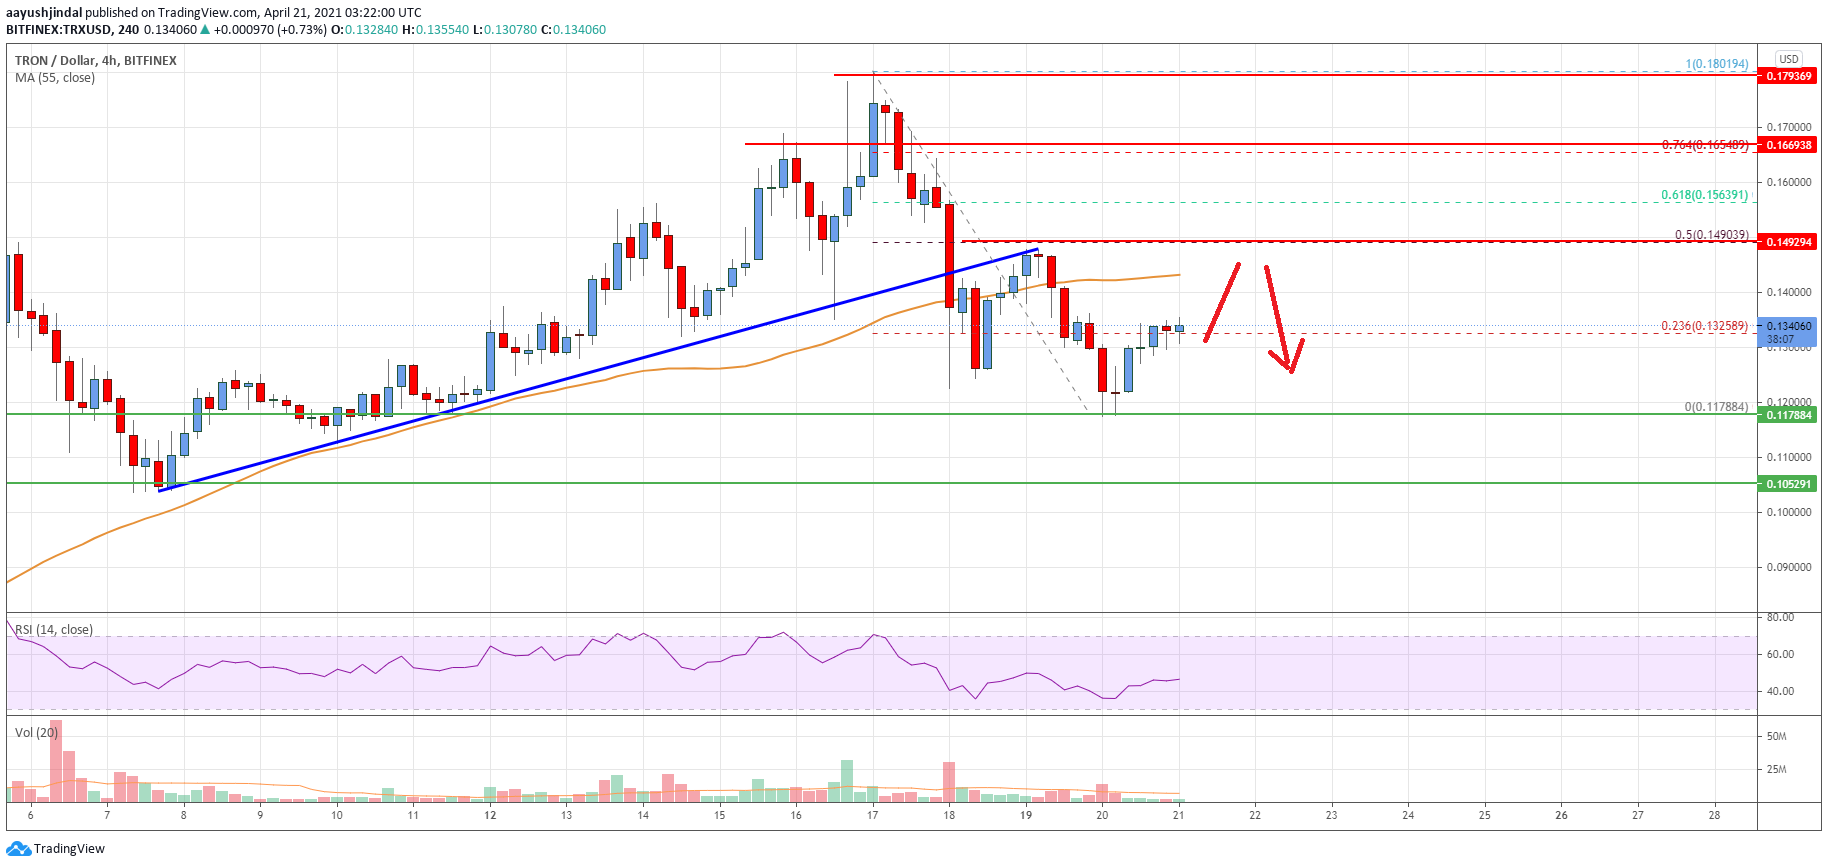
The chart indicates that TRX price is clearly trading below the $0.1500 support and the 55 simple moving average (4-hours). Overall, the price could correct higher, but the bulls must gain strength above $0.1500 for more gains.
Technical Indicators
4 hours MACD – The MACD for TRX/USD is slowly gaining momentum in the bullish zone.
4 hours RSI – The RSI for TRX/USD is still below the 50 level.
Key Support Levels – $0.1250 and $0.1200.
Key Resistance Levels – $0.1420, $0.1450 and $0.1500.
