- Tron price started an upside correction from the $0.0117 low against the US Dollar.
- TRX price is currently trading near the key $0.0150 and $0.0152 resistance levels.
- There was a break above an ascending channel with resistance near $0.0144 on the 4-hours chart (data feed via Bitfinex).
- The price could climb sharply if there is a proper close above $0.0150 and $0.0152.
TRON price is currently correcting higher against the US Dollar and bitcoin. TRX price needs to surpass the $0.0152 resistance area to continue higher in the near term.
Tron Price Analysis
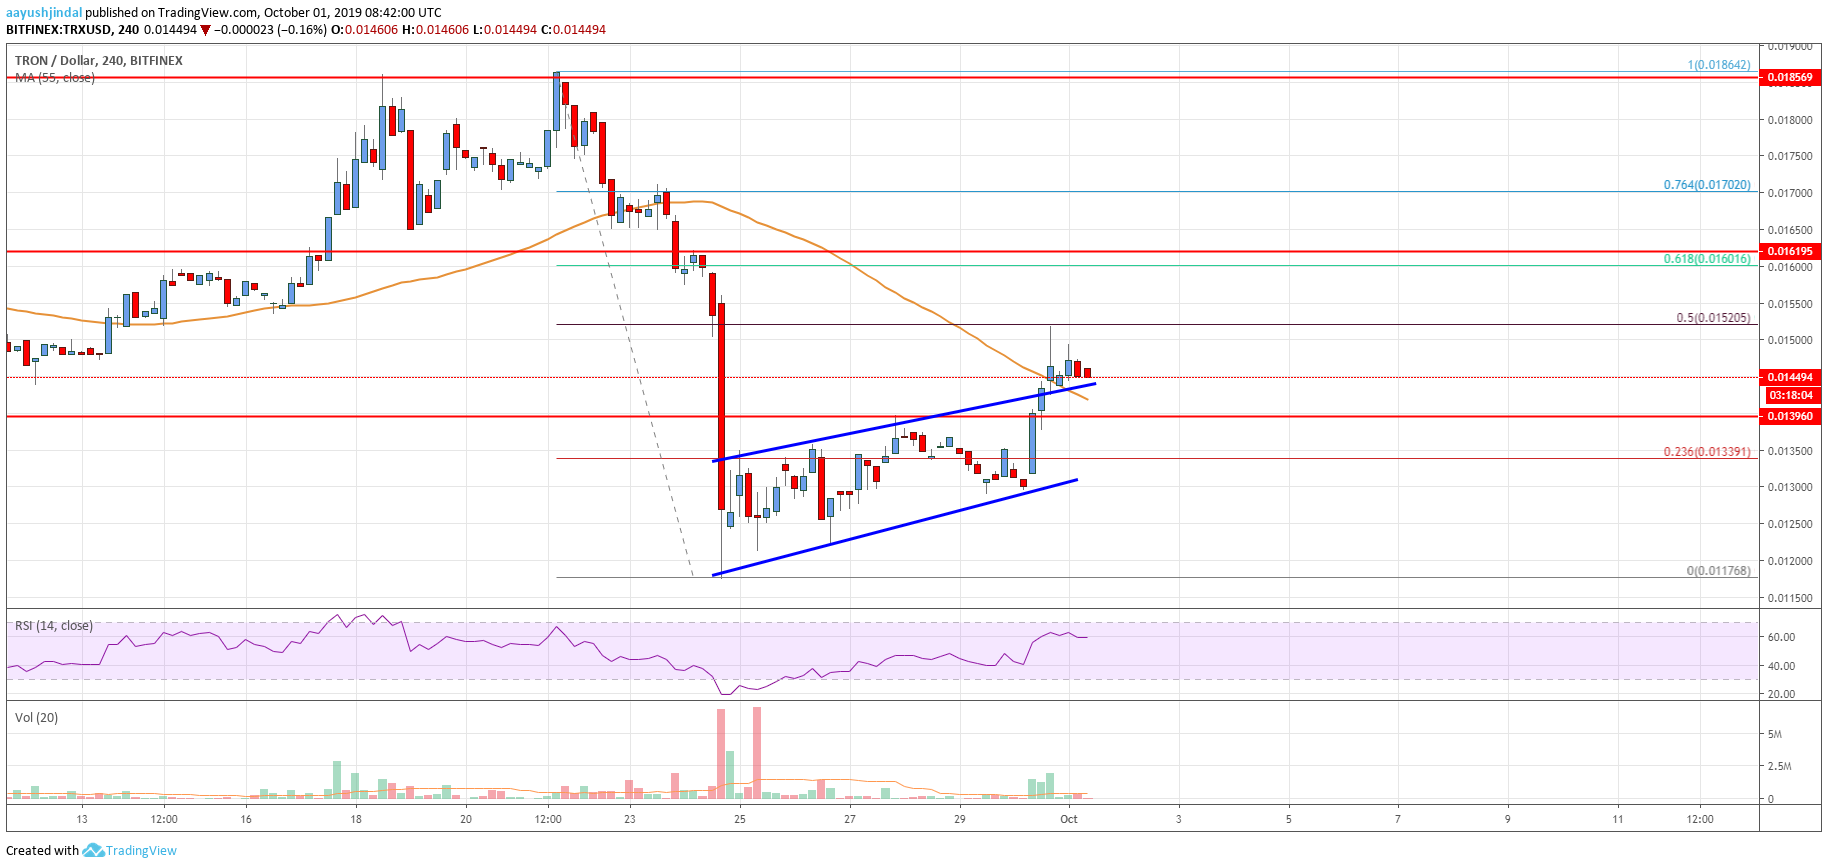
This past week, TRON price declined heavily below the $0.0160 and $0.0150 supports against the US Dollar. The price even settled below the $0.0150 level and the 55 simple moving average (4-hours). Moreover, there was a break below the $0.0125 support. Finally, the price traded as low as $0.0117 and recently started an upside correction. It broke the $0.0125 resistance to start a corrective increase.
Moreover, there was a break above the 23.6% Fibonacci retracement level of the last drop from the $0.0186 high to $0.0117 low. There was also a break above an ascending channel with resistance near $0.0144 on the 4-hours chart. The pair even spiked above $0.0150 and the 55 simple moving average (4-hours). However, the price faced a strong resistance near the $0.0152 level.
It seems like the 50% Fibonacci retracement level of the last drop from the $0.0186 high to $0.0117 low acted as a resistance. The price is currently consolidating below the $0.0150 level and near the 55 SMA. If the price fails to continue higher, it could decline towards the $0.0140 support. If there are more downsides, the price is likely to revisit the $0.0125 support area.
Conversely, an upside break above $0.0150 and $0.0152 will most likely open the doors for a sharp increase. The next key resistance is near the $0.0160 level. It represents the 61.8% Fibonacci retracement level of the last drop from the $0.0186 high to $0.0117 low. Therefore, the bears are likely to take a stand near the $0.0160 level.

The chart indicates that TRX price is clearly struggling to gain bullish momentum above the $0.0150 and $0.0152 resistance levels. If it continues to struggle near $0.0150, there are chances of a fresh dip towards the $0.0140 and $0.01250 support levels. On the upside, the next target for the bulls may be $0.0160.
Technical Indicators
4 hours MACD – The MACD for TRX/USD is likely to move back into to bearish zone.
4 hours RSI – The RSI for TRX/USD is currently well above the 50 level, with a positive bias.
Key Support Levels – $0.0140 and $0.0125.
Key Resistance Levels – $0.0150, $0.0152 and $0.0160.


Leave a Reply
You must be logged in to post a comment.