- Tron price climbed higher above $0.0180 before starting a downside correction against the US Dollar.
- TRX price is currently trading below $0.0170 and it is trading near a crucial support area.
- There is a key bullish trend line forming with support near $0.0158 on the 4-hours chart (data feed via Bitfinex).
- The price could either breakdown below $0.0155 or it might start a fresh increase above $0.0165.
TRON price is currently trading near important supports against the US Dollar and bitcoin. TRX price must stay above $0.0155 to start a fresh increase in the near term.
Tron Price Analysis
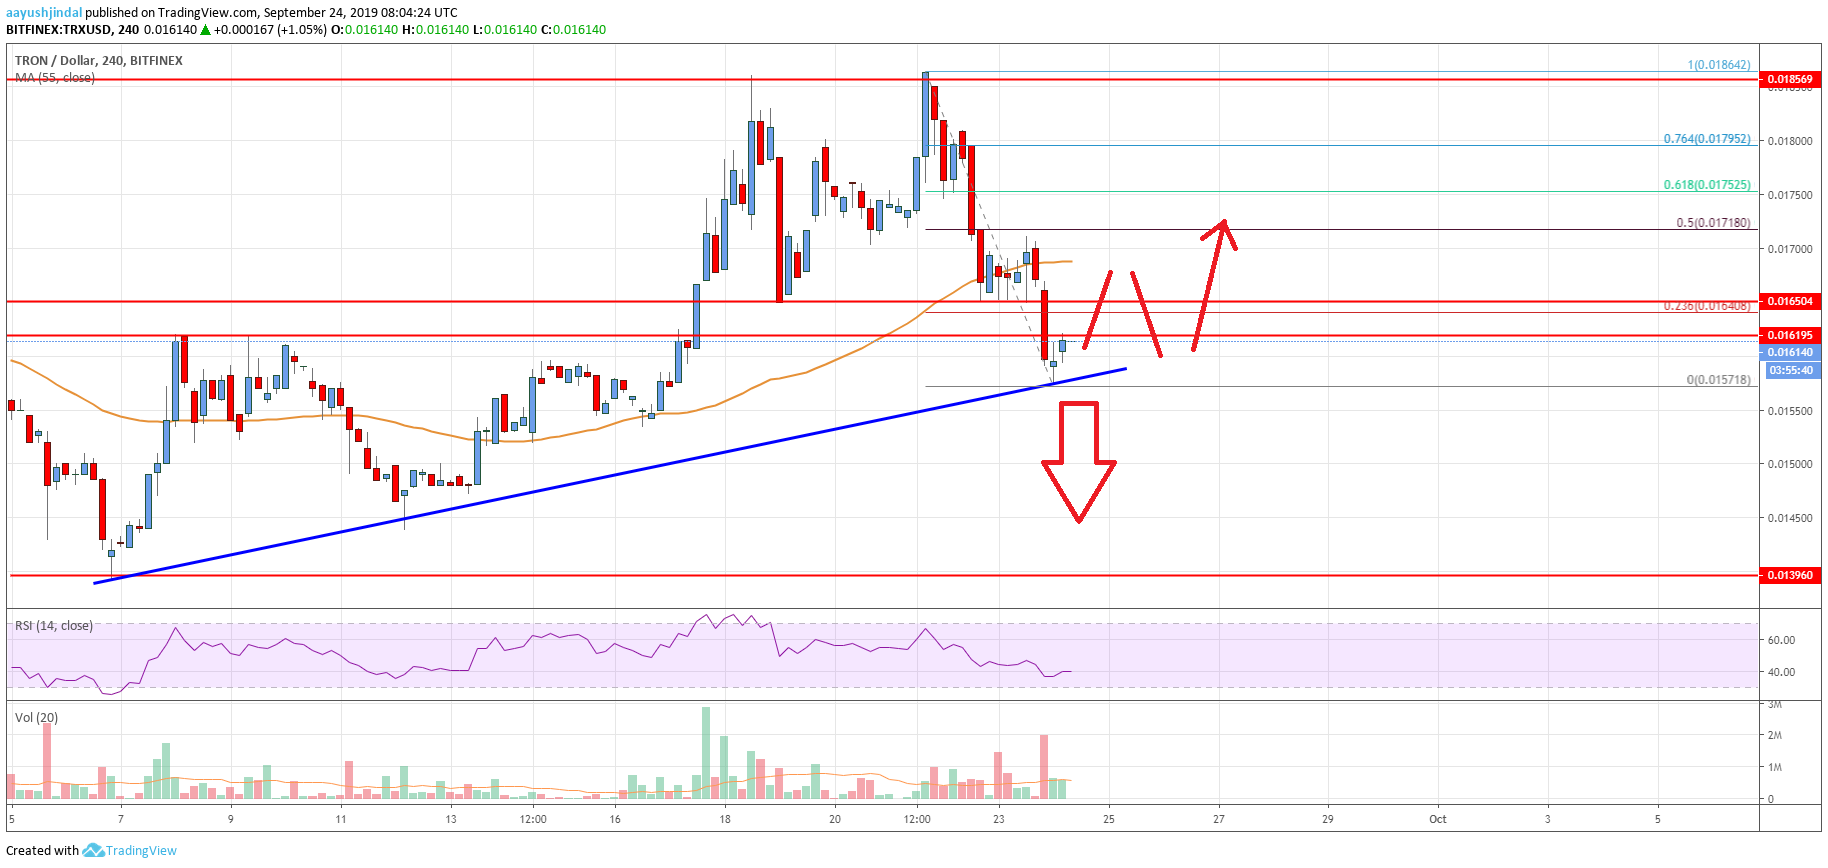
This past week, TRON price started a solid upward move above the $0.0170 resistance against the US Dollar. The price even climbed above the $0.0180 resistance and the 55 simple moving average (4-hours). Finally, the price tested the $0.0185 resistance area, which once again acted as a strong hurdle. A swing high was formed near $0.0186 and the price started a major downside correction.
There was a break below the $0.0180 and $0.0178 support levels. Moreover, there was a close below the $0.0170 level and 55 simple moving average (4-hours). The price even broke the main $0.0165 support area. Finally, the price spiked below $0.0160 and traded as low as $0.0157. At the moment, the price is holding the $0.0158 support. More importantly, there is a key bullish trend line forming with support near $0.0158 on the 4-hours chart.
On the upside, an immediate resistance is near the $0.0165 level. It coincides with the 23.6% Fibonacci retracement level of the recent decline from the $0.0186 high to $0.0157 low. However, the main resistance is near the $0.0170 level and the 55 simple moving average (4-hours). The 50% Fibonacci retracement level of the recent decline from the $0.0186 high to $0.0157 low is also near $0.0171.
Therefore, an upside break above the $0.0165 and $0.0170 levels is must for a fresh increase. On the other hand, a downside break below the trend line and the $0.0155 support might set the pace for another drop. The next key support is near the $0.0145 level.

The chart indicates that TRX price is trading near a key support at $0.0158. As long as there is no close below $0.0158 and $0.0155, there are chances of a fresh increase. The main resistance are near the $0.0165 and $0.0170 levels.
Technical Indicators
4 hours MACD – The MACD for TRX/USD is slowly reducing its bearish slope.
4 hours RSI – The RSI for TRX/USD is currently near the 40 level, with a flat structure.
Key Support Levels – $0.0158 and $0.0155.
Key Resistance Levels – $0.0165, $0.0170 and $0.0175.


Leave a Reply
You must be logged in to post a comment.