- Tron price is gaining momentum and it recently climbed above $0.0150 against the US Dollar.
- TRX price is currently testing the $0.0165 resistance and it could rise further in the near term.
- There is a crucial bullish trend line forming with support near $0.0150 on the 4-hours chart (data feed via Bitfinex).
- The price could surge towards $0.0180 or $0.0185 once it surpasses the $0.0165 resistance area.
TRON price is showing positive signs against the US Dollar and bitcoin. TRX price is likely to continue higher and it might soon test the $0.0180 resistance area.
Tron Price Analysis
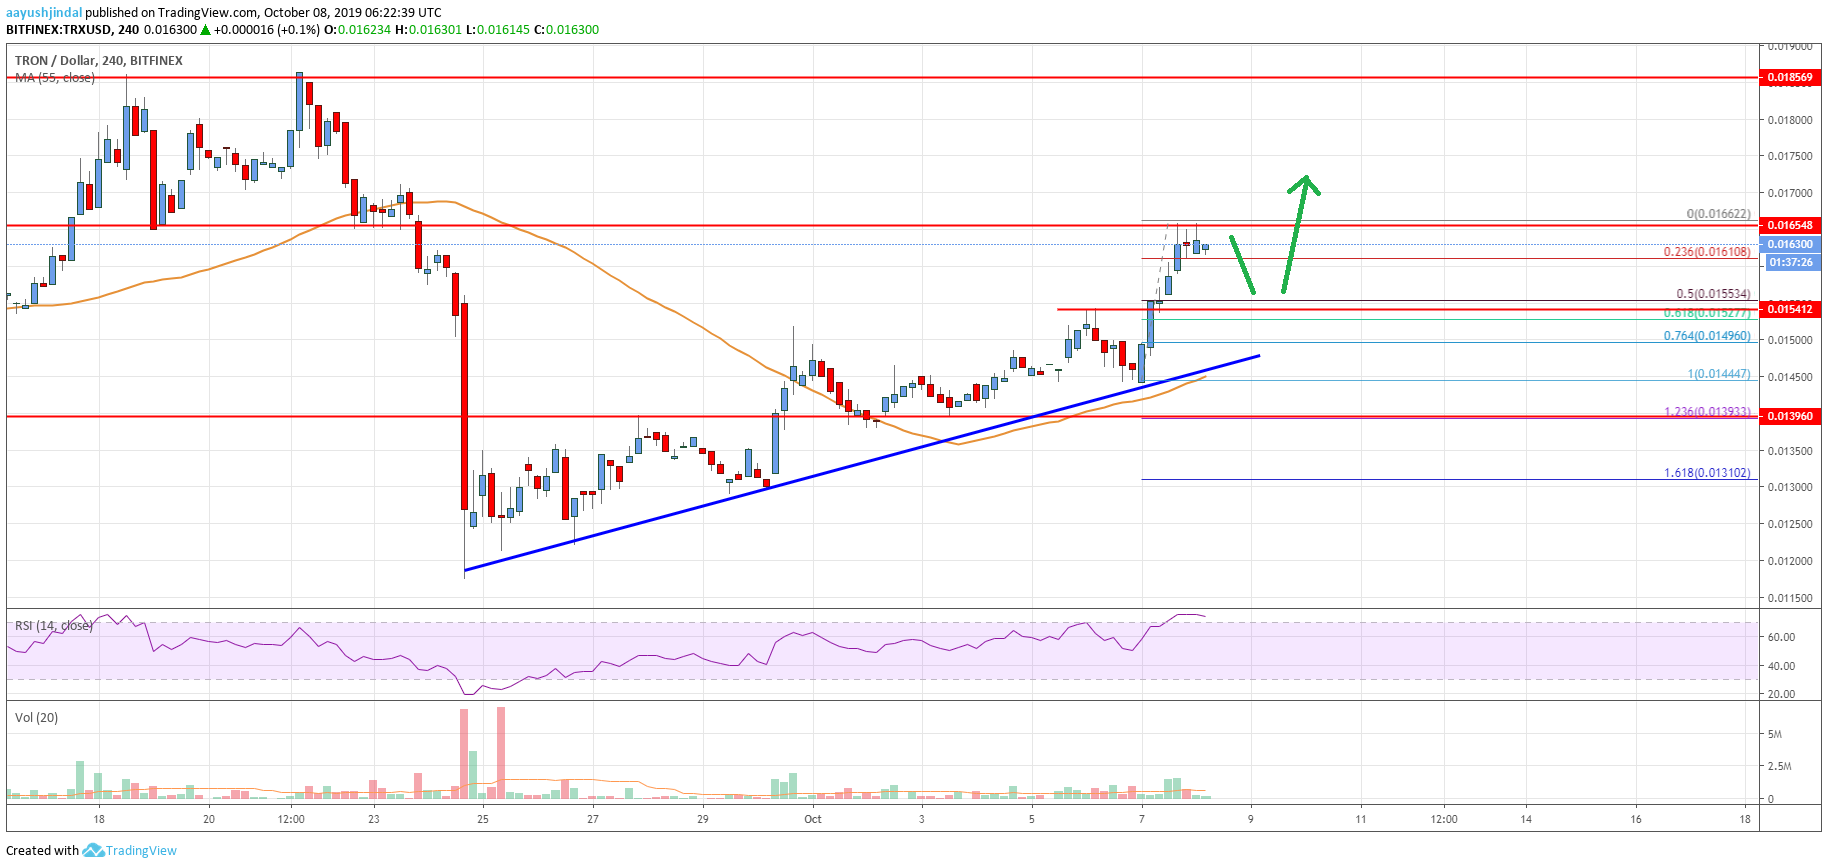
This past week, TRON price formed a decent support base near the $0.0140 level against the US Dollar. As a result, TRX price started a fresh increase above the $0.0145 and $0.0150 resistance levels. Moreover, there was a close above the $0.0150 level and the 55 simple moving average (4-hours). It opened the doors for more gains and the price climbed above the $0.0160 resistance.
Finally, the price tested the $0.0165 resistance and it is currently consolidating gains. An immediate support is near the $0.0161 level. It coincides with the 23.6% Fibonacci retracement level of the recent wave from the $0.0144 low to $0.0166 high. However, the main support on the downside is near the $0.0155 level. It represents the 50% Fibonacci retracement level of the recent wave from the $0.0144 low to $0.0166 high.
Moreover, there is a crucial bullish trend line forming with support near $0.0150 on the 4-hours chart. The trend line support also coincides with the 55 simple moving average (4-hours) near $0.0145. Therefore, dips towards the $0.0155 and $0.0150 levels might find a strong buying interest in the near term.
On the upside, there is a crucial resistance forming near the $0.0165 and $0.0166 levels. If there is a successful break above the $0.0166 resistance, the price is likely to accelerate higher. The next stop for the bulls could be near the $0.0180 level. However, the main resistance is near the $0.0185 level (the previous swing high).
The chart indicates that TRX price is trading nicely in a bullish zone above the $0.0155 support area. Once the bulls clear the $0.0166 resistance area, there are chances of more upsides towards the $0.0180 and $0.0185 levels. Conversely, if there is a downside correction, the $0.0155 and $0.0150 levels are likely to stop the decline.
Technical Indicators
4 hours MACD – The MACD for TRX/USD is showing positive signs in to bullish zone.
4 hours RSI – The RSI for TRX/USD is currently correcting lower from the overbought levels.
Key Support Levels – $0.0155 and $0.0150.
Key Resistance Levels – $0.0166, $0.0180 and $0.0185.