
- Tron price is trading in a bullish zone above the $0.0160 support area against the US Dollar.
- TRX price recently tested the $0.0180 resistance area before correcting lower.
- There is a major bullish trend line forming with support near $0.0160 on the 4-hours chart (data feed via Bitfinex).
- The current price action is positive, suggesting more upsides above $0.0170 in the near term.
TRON price is showing a lot of positive signs against the US Dollar, similar to bitcoin. TRX price is likely to continue higher above the $0.0170 and $0.0180 levels in the near term.
Tron Price Analysis
In the past few days, TRON price followed a nice bullish path above the $0.0150 resistance area against the US Dollar. TRX price surpassed the key $0.0165 and $0.0170 resistance levels to move into a positive zone.
Moreover, there was a close above the $0.0160 level and the 55 simple moving average (4-hours). Finally, the price climbed above the $0.0175 level and traded to a new 2020 high at $0.0182.
Recently, there was a downside correction below the $0.0170 support level. Tron price traded below the 23.6% Fibonacci retracement level of the upward leg from the $0.0136 low to $0.0182 high.
However, the decline was protected by the $0.0160 support area and the 55 simple moving average (4-hours). More importantly, there is a major bullish trend line forming with support near $0.0160 on the 4-hours chart.
The pair also remained well bid above the 50% Fibonacci retracement level of the upward leg from the $0.0136 low to $0.0182 high. If there is a downside break below the trend line and the $0.0160 support, the price could extend its decline.
The next major support is near the $0.0150 level or the 76.4% Fibonacci retracement level of the upward leg from the $0.0136 low to $0.0182 high. Any further losses may perhaps push the price towards the $0.0132 support area.
On the upside, the $0.0170 level is an initial resistance for the bulls. If there is a clear break above the $0.0170 barrier, the price is likely to rise towards the $0.0180 and $0.0182 resistance levels. The next key hurdle is near $0.0195.
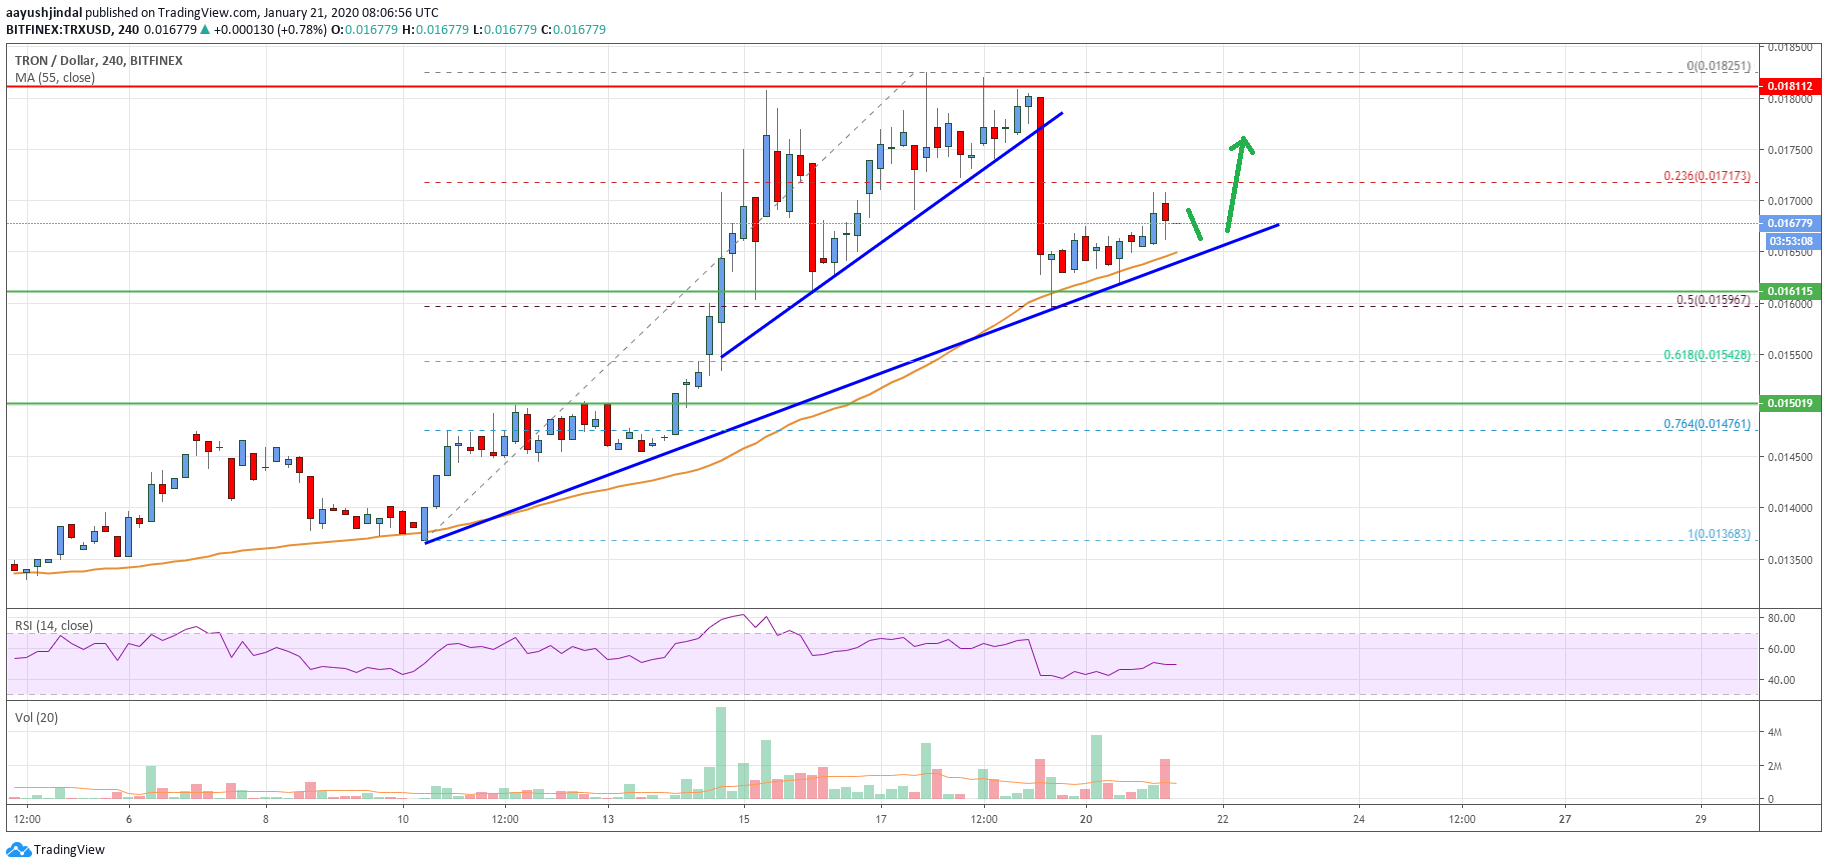
The chart indicates that TRX price is showing a lot of positive signs and it could continue to rise towards $0.0182 or even $0.0195 unless the bears push the price below $0.0160.
Technical Indicators
4 hours MACD – The MACD for TRX/USD is losing momentum in the bearish zone.
4 hours RSI – The RSI for TRX/USD is currently just below the 50 level.
Key Support Levels – $0.0162 and $0.0162.
Key Resistance Levels – $0.0170, $0.0180 and $0.0182.


Leave a Reply
You must be logged in to post a comment.