
- Tron price is facing a major resistance near the $0.0200 and $0.0204 levels against the US Dollar.
- TRX price is struggling to stay above the key $0.0185 support area.
- There is a major bearish trend line forming with resistance near $0.0195 on the 4-hours chart (data feed via Bitfinex).
- The price could start a substantial decline if it fails to stay above the $0.0185 support area.
TRON price is trading in a contracting range against the US Dollar and bitcoin. TRX price remains at a risk of a downside break if it continues to struggle near $0.0204.
Tron Price Analysis
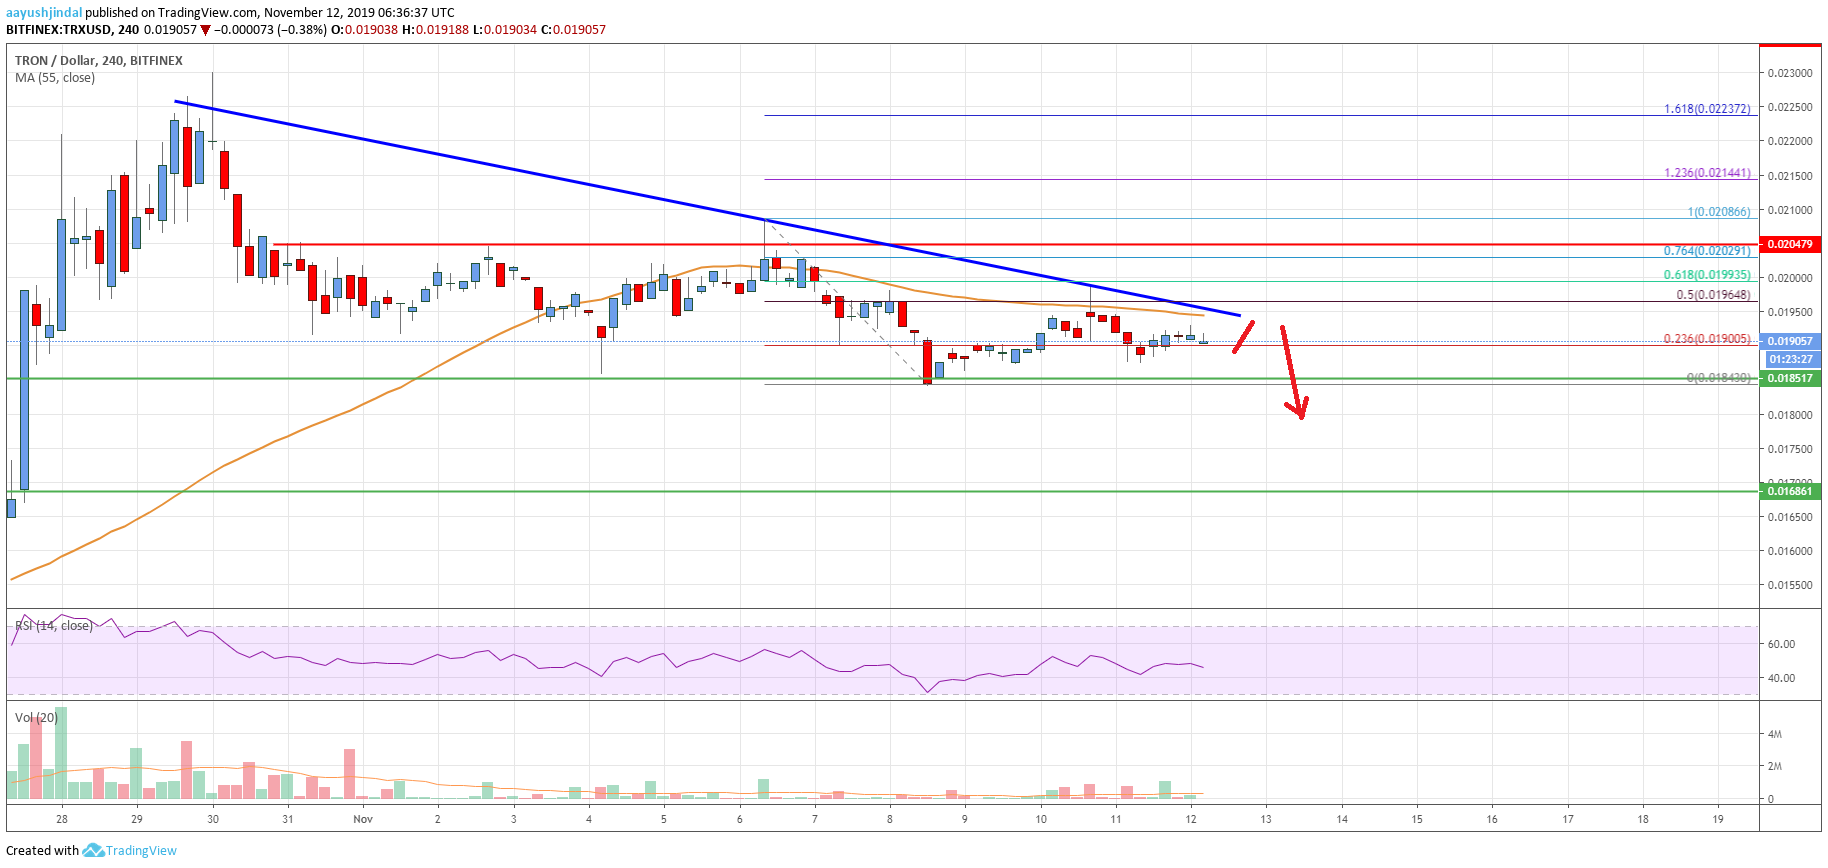
After a strong rally, TRON price started a steady decline from the $0.0235 resistance against the US Dollar. TRX price traded below a couple of important supports near the $0.0215 and $0.0204 levels to enter a bearish zone.
Moreover, there was a close below the $0.0204 level and the 55 simple moving average (4-hours). On the downside, the $0.0185 level is acting as a strong support. The recent low was near $0.0184 before the price started an upside correction.
Tron is currently trading above the $0.0190 level. Additionally, it climbed above the 23.6% Fibonacci retracement level of the recent decline from the $0.0208 high to $0.0184 low.
However, there are many resistances on the upside near the $0.0195 level and the 55 simple moving average (4-hours). More importantly, there is a major bearish trend line forming with resistance near $0.0195 on the 4-hours chart.
The trend line also coincides with the 50% Fibonacci retracement level of the recent decline from the $0.0208 high to $0.0184 low. If there is an upside break above $0.0195 and $0.0200, the price could correct higher towards the $0.0204 resistance area.
To start a fresh increase, tron price needs to surpass the $0.0200 and $0.0204 resistance levels. A clear break above the $0.0204 might set the pace for a decent upward move towards the $0.0225 and $0.0230 levels.
Conversely, the price could break the $0.0185 support area to move further into a bearish zone. In the mentioned case, the price is likely to revisit the $0.0168 support area in the near term.
The chart indicates that TRX price is struggling to hold the key $0.0185 support area. If the bulls continue to face resistance near the $0.0200 and $0.0204 levels, there is a risk of a downside break below the $0.0185 support.
Technical Indicators
4 hours MACD – The MACD for TRX/USD is slowly losing momentum in the bullish zone.
4 hours RSI – The RSI for TRX/USD is currently declining and it is well below the 50 level.
Key Support Levels – $0.0185 and $0.0168.
Key Resistance Levels – $0.0195, $0.0200 and $0.0204.


Leave a Reply
You must be logged in to post a comment.