- Tron price struggled to clear the $0.1365 resistance and corrected lower against the US Dollar.
- TRX price is now trading below the $0.1260 support and the 55 simple moving average (4-hours).
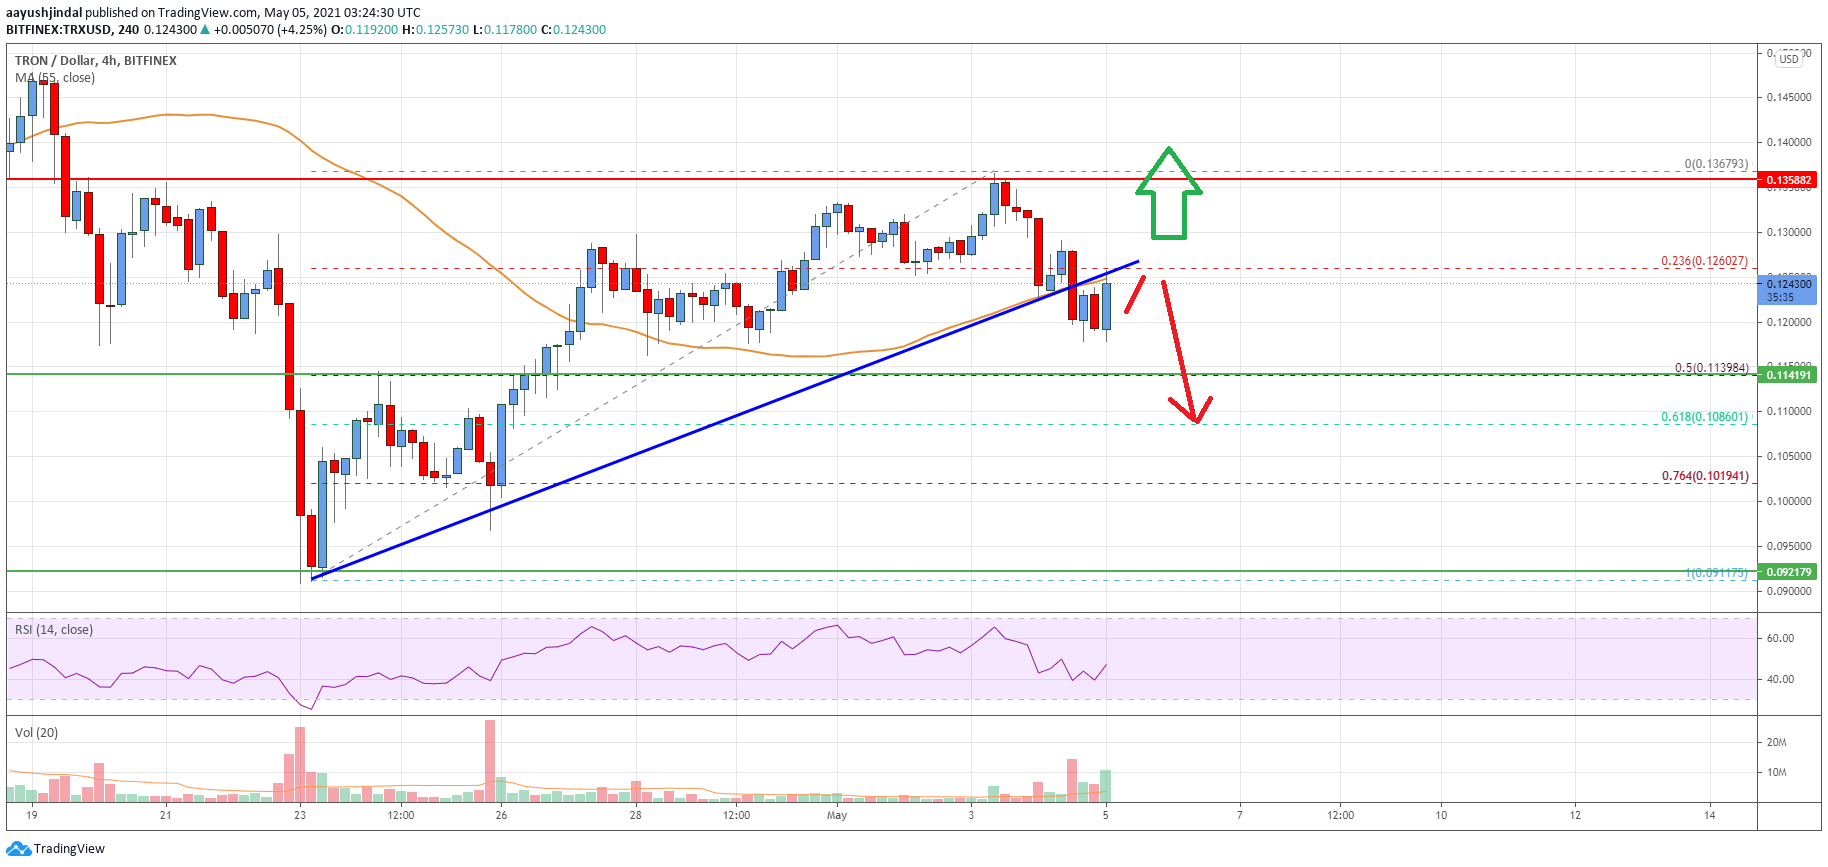
- There was a break below a key bullish trend line with support near $0.1250 on the 4-hours chart (data feed via Bitfinex).
- The pair could extend its decline if it fails to recover above $0.1265 and $0.1300.
TRON price is showing a few bearish signs below $0.1300 against the US Dollar, similar to bitcoin. TRX price remains at a risk of a sharp decline below the $0.1130 and $0.1100 support levels.
Tron Price Analysis
In the past few days, there was a steady recovery in tron price above the $0.1100 pivot level against the US Dollar. TRX price even climbed above the $0.1250 resistance and the 55 simple moving average (4-hours).
However, the price failed to clear the $0.1365 resistance zone. A high was formed near $0.1367 before the price started a downside correction. There was a break below the 23.6% Fib retracement level of the upward move from the $0.9117 low to $0.1367 high.
There was also a break below a key bullish trend line with support near $0.1250 on the 4-hours chart. The pair is now trading below the $0.1260 support and the 55 simple moving average (4-hours).
An immediate support is near the $0.1140 level. It is near the 50% Fib retracement level of the upward move from the $0.9117 low to $0.1367 high. If there is a downside break below the $0.1140 support, tron could accelerate lower.
The next key support is near the $0.1100 level, below which there is a risk of a drop towards the $0.1000 support. On the upside, an immediate resistance is near the $0.1260 and $0.1265 levels.
The next major resistance could be $0.1365, above which the price could rise towards the $0.1500 zone. Any more gains could lead the price towards the $0.1600 level.

The chart indicates that TRX price is clearly now trading below the $0.1260 support and the 55 simple moving average (4-hours). Overall, the price could extend its decline if it fails to recover above $0.1265 and $0.1300.
Technical Indicators
4 hours MACD – The MACD for TRX/USD is slowly losing momentum in the bullish zone.
4 hours RSI – The RSI for TRX/USD is now below the 50 level.
Key Support Levels – $0.1140 and $0.1100.
Key Resistance Levels – $0.1265, $0.1365 and $0.1500.


Leave a Reply
You must be logged in to post a comment.