- Tron price failed to stay above the $0.0235 support and declined recently against the US Dollar.
- TRX traded below the $0.0230 support and the 55 simple moving average (4-hours).
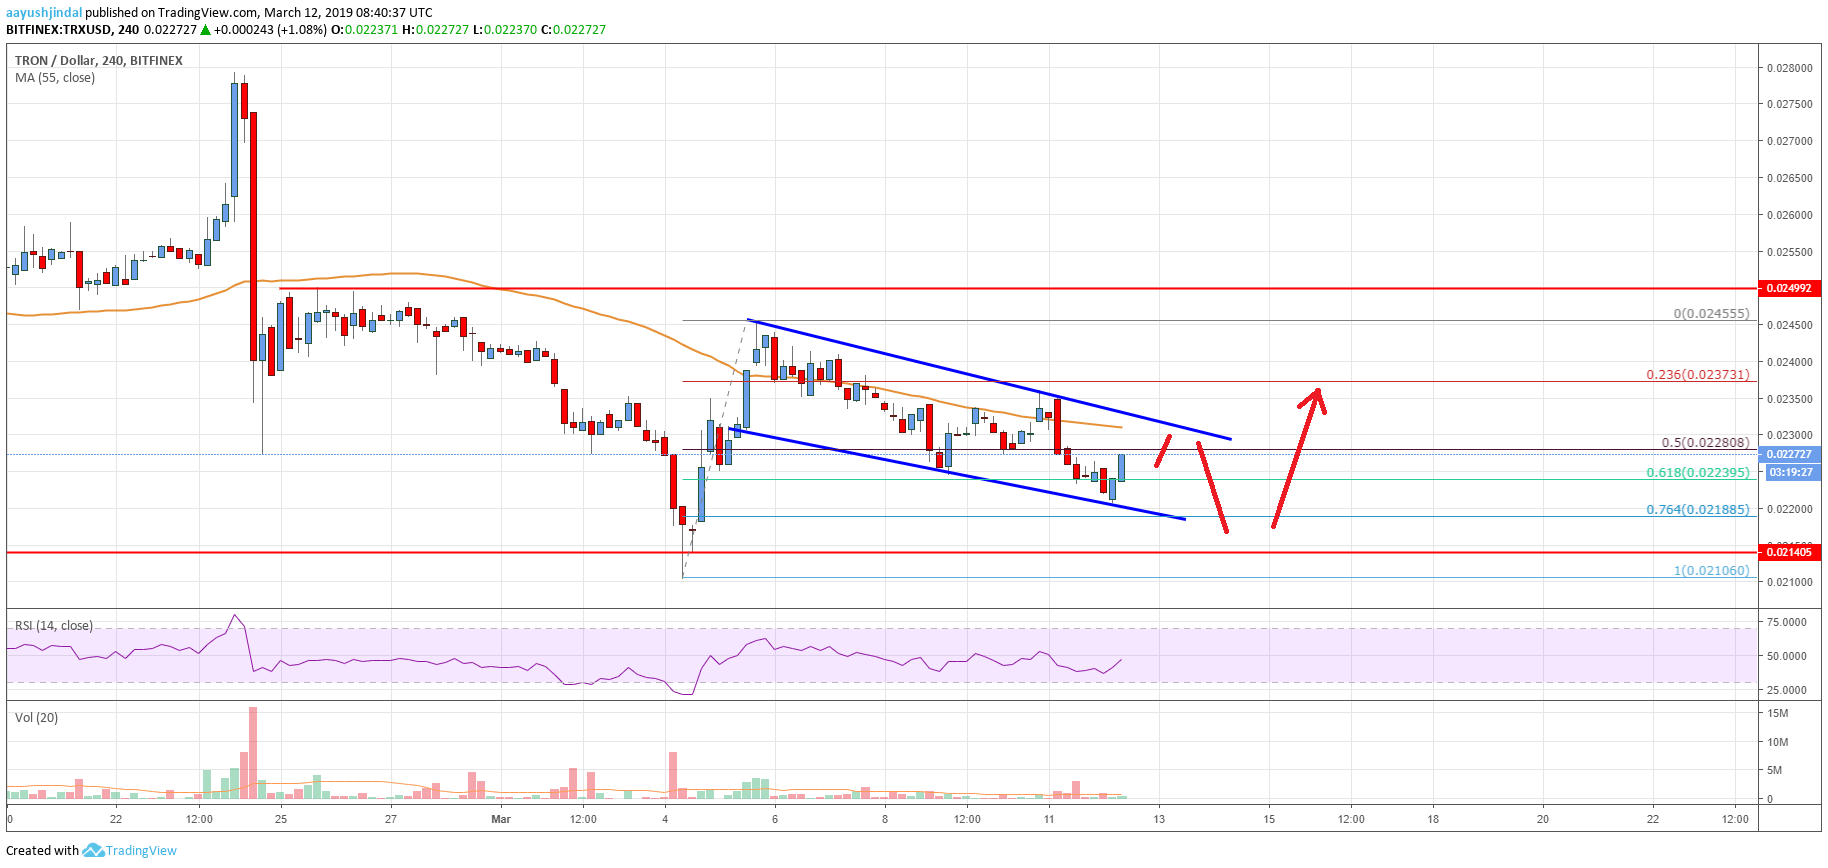
- There is a crucial declining channel in place with resistance at $0.0232 on the 4-hours chart (data feed via Bitfinex).
- The price is likely to extend losses towards the $0.0215 support before it could start a decent rebound.
TRON price is under pressure below key supports against the US Dollar and Bitcoin. TRX could continue to move down towards $0.0215 or $0.0210 before buyers take a stand.
Tron Price Analysis
This past week, there was a sharp rise in TRON price from the $0.0210 swing low against the US Dollar. The TRX/USD pair rallied above the $0.0230 and $0.0240 resistance levels. However, the price failed near the $0.0245 level and later started a downward move. It declined steadily below the$0.0235 and $0.0230 support levels. There was even a close below the $0.0230 support and the 55 simple moving average (4-hours). Besides, there was a break below the 50% Fibonacci retracement level of the last wave from the $0.0210 low to $0.0245 high.
The decline was such that the price tested the $0.0220 support. TRX even traded close to the 76.4% Fibonacci retracement level of the last wave from the $0.0210 low to $0.0245 high. It is currently correcting higher, but there are many resistances on the upside near the $0.0230 level. More importantly, there is a crucial declining channel in place with resistance at $0.0232 on the 4-hours chart. If the price continues to move higher, it could face a strong resistance near $0.0230 and $0.0232.
As long as the price is below the $0.0232 resistance, there is a risk of more losses. An initial support is at $0.0220 level, below which the price may decline sharply. It could test the $0.0214 support or the last swing low at $0.0210 in the near term. Having said that, there are high chances of a bullish reaction from the $0.0214 or $0.0210 support.

The chart indicates that TRX price is clearly following a bearish pattern below $0.0232. At the same time, the price is approaching a couple of important support levels near the $0.0214 and $0.0210 levels. It seems like buyers are likely to defend the $0.0210 support if the price extends losses from the current levels.
Technical Indicators
4 hours MACD – The MACD for TRX/USD is slowly reducing its bearish slope, with a slight positive bias.
4 hours RSI – The RSI for TRX/USD is slowly moving higher towards the 50 level, with a bullish angle.
Key Support Levels – $0.0214 and $0.0210
Key Resistance Levels – $0.0230, $0.0232 and $0.0240.


Leave a Reply
You must be logged in to post a comment.