- Tron price extended losses and traded below the $0.0260 support level against the US Dollar.
- TRX tested the $0.0244 level and it is currently consolidating near the $0.0250 level.
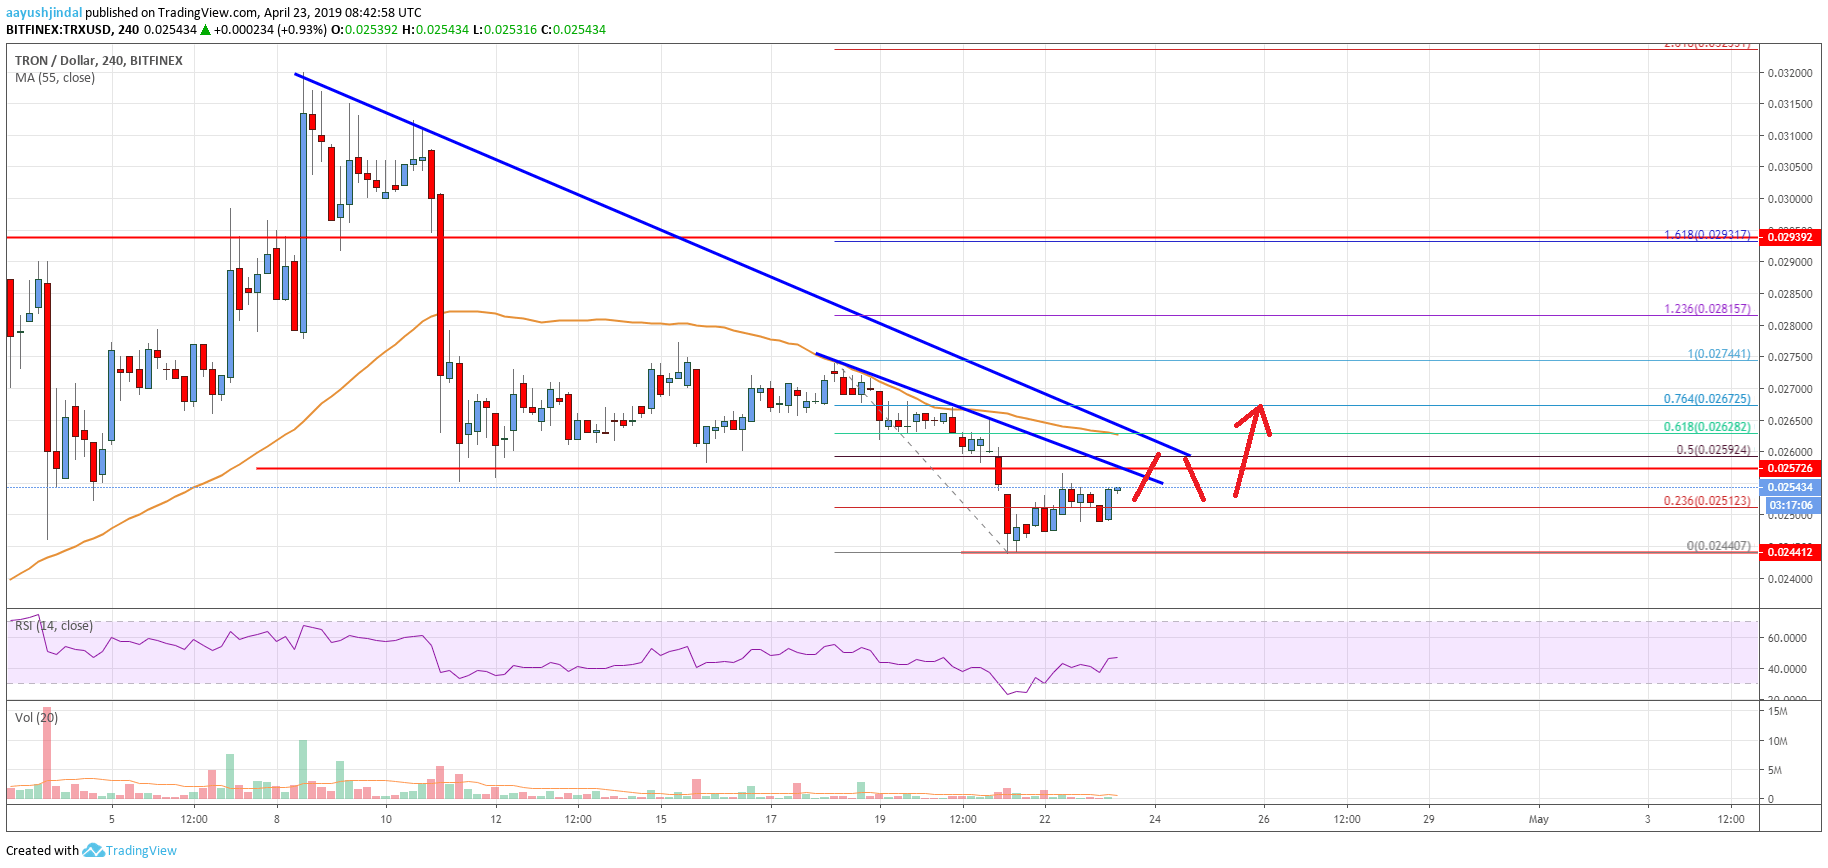
- There is a key bearish trend line in place with resistance at $0.0260 on the 4-hours chart (data feed via Bitfinex).
- The price must break the $0.0258 and $0.0260 resistance levels to move into a positive zone.
TRON price is currently under pressure against the US Dollar and bitcoin. TRX seems to be forming a decent support above $0.0242 and it could attempt to rebound above $0.0260 and $0.0280.
Tron Price Analysis
This past week, TRON price consolidated above the $0.0260 support area against the US Dollar. The TRX/USD pair failed to gain traction above the $0.0275 resistance, resulting in a bearish reaction. The price resumed its decline below the $0.0265 and $0.0260 support levels. There was a break below the $0.0255 support as well along with the 55 simple moving average (4-hours), and the price finally spiked below $0.0250. A new swing low was formed at $0.0244 and recently the price corrected higher.
It broke the $0.0250 level and the 23.6% Fibonacci retracement level of the last decline from the $0.0274 high to $0.0244 low. However, there are many hurdles for tron buyers on the upside near the $0.0260 level. There is also a key bearish trend line in place with resistance at $0.0260 on the 4-hours chart. The 50% Fibonacci retracement level of the last decline from the $0.0274 high to $0.0244 low is also near the $0.0260 level. A clear break above the trend line and then $0.0262 is needed for the bulls to gain control.
If there is a successful close above the $0.0260 and $0.0262 levels, the price is likely to climb towards the $0.0275 level. If there are further gains, the price may revisit the $0.0300 resistance area. On the downside, the main supports are $0.0250 and $0.0245. If there is a bearish break below $0.0245, the price is likely to resume it slide below $0.0240 and $0.0220.

The chart indicates that TRX price seems to be preparing a support base for a decent rebound above $0.0260. However, the bulls must gain momentum above $0.0262 to start a strong upward move. If they continue to struggle, there is a risk of a fresh decline below the $0.0250 support area in the near term.
Technical Indicators
4 hours MACD – The MACD for TRX/USD is currently flat in the bullish zone, with a few positive signs.
4 hours RSI – The RSI for TRX/USD is currently just below the 50 level.
Key Support Levels – $0.0250 and $0.0245.
Key Resistance Levels – $0.0260, $0.0262 and $0.0275.


Leave a Reply
You must be logged in to post a comment.