- Tron price struggled to clear the $0.0245 resistance and declined recently against the US Dollar.
- TRX traded below the $0.0230 support area and the 55 simple moving average (4-hours).
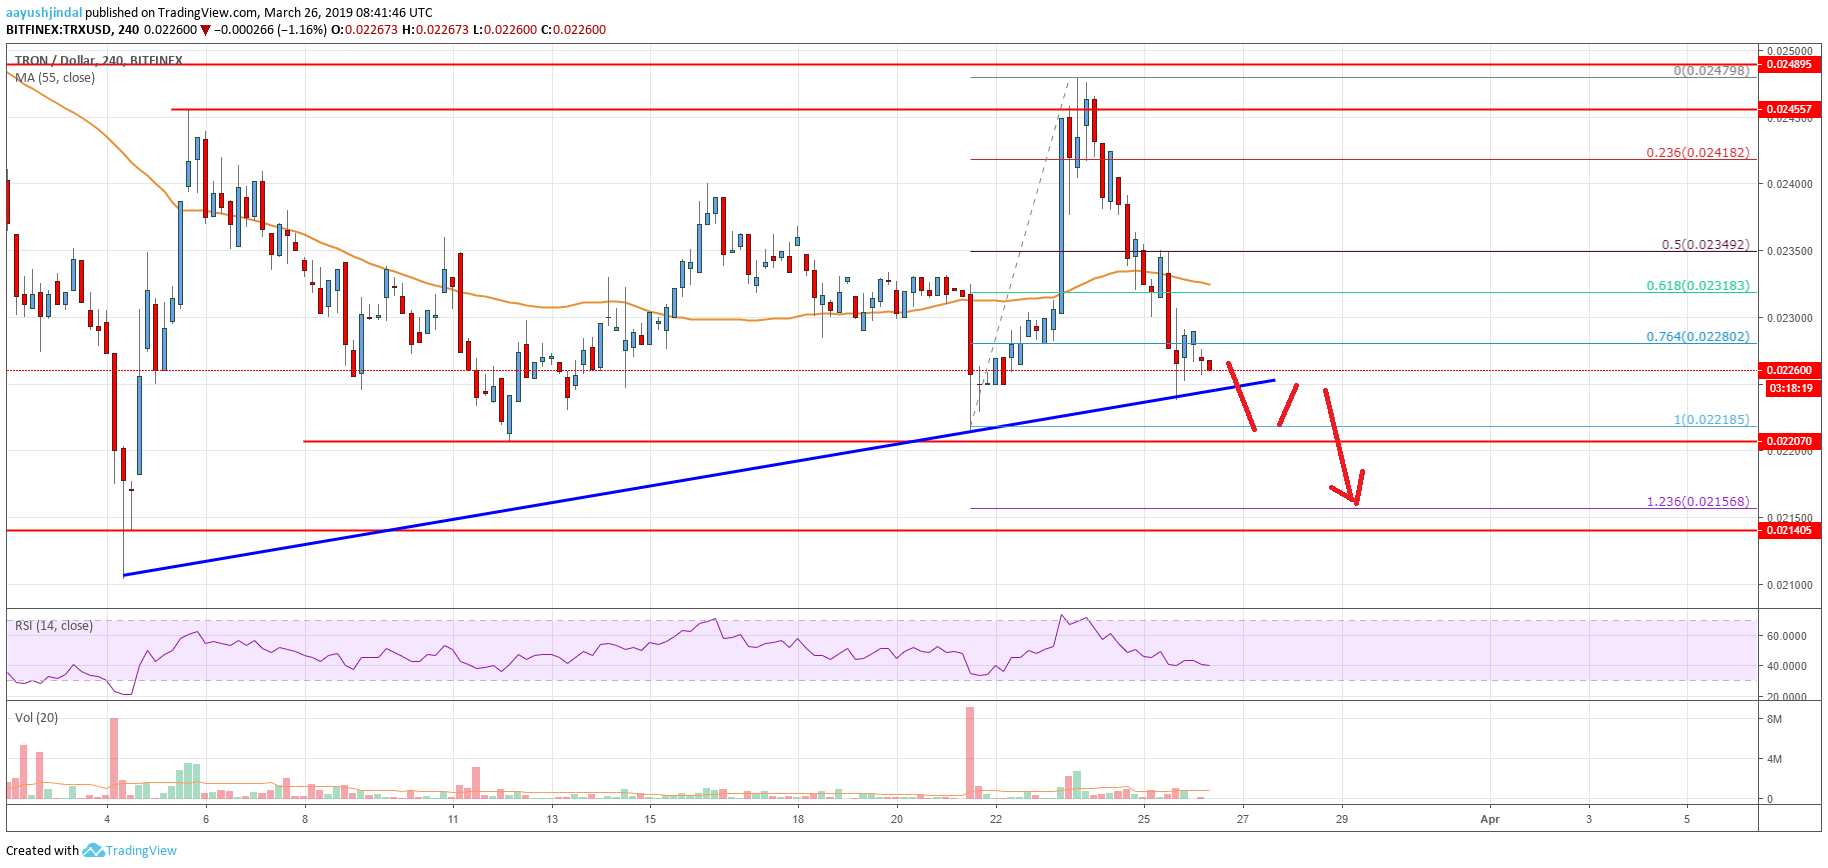
- There is a major bullish trend line formed with support at $0.0225 on the 4-hours chart (data feed via Bitfinex).
- The price is currently trading with a bearish bias and it could accelerate losses below $0.0220.
TRON price is currently under a lot of selling pressure against the US Dollar and Bitcoin. TRX might soon break the $0.0220 support level and accelerate losses in the near term.
Tron Price Analysis
This past week, TRON price found a decent support base near the $0.0222 level against the US Dollar. The TRX/USD pair started a nice upward move and traded above the $0.0230 and $0.0240 levels. The price even broke the $0.0242 level, but it faced a strong resistance near the $0.0245 level. A swing high was formed at $0.0247 and later the price started a fresh decline. Sellers gained control below $0.0240 and pushed the price into a bearish zone.
The decline was strong as the price broke the 61.8% Fibonacci retracement level of the last wave from the $0.0221 low to $0.0247 high. Besides, there was a close below the $0.0230 support and the 55 simple moving average (4-hours). The price is now trading in a bearish zone below the 76.4% Fibonacci retracement level of the last wave from the $0.0221 low to $0.0247 high. On the downside, an immediate support is near the $0.0225 level.
There is also a major bullish trend line formed with support at $0.0225 on the 4-hours chart. The current price action suggests more losses in TRX below the $0.0225 and $0.0220 support levels. Sellers might target the 1.236 Fib extension level of the last wave from the $0.0221 low to $0.0247 high at $0.0215. Moreover, if sellers remain in action, there are chances of a break towards the $0.0210 level.

The chart indicates that TRX price is clearly trading in a bearish zone below $0.0230 and the 55 simple moving average (4-hours). If there is an upside correction, the price could face selling interest near $0.0230 and $0.0231. Only a close above $0.0232 and the 55 SMA might open the doors for more gains in the near term. If not, there is a risk of a downside break below the $0.0220 support level.
Technical Indicators
4 hours MACD – The MACD for TRX/USD is gaining momentum in the bearish zone, with negative signs.
4 hours RSI – The RSI for TRX/USD is now well below the 50 level and it is could test the 30 level.
Key Support Levels – $0.0225 and $0.0220
Key Resistance Levels – $0.0230, $0.0232 and $0.0240.


Leave a Reply
You must be logged in to post a comment.