
Why is Bitcoin down? A rare taker buy signal just lit up BTC futures, the 7th extreme reading of 2026, yet history says the rally may not last.
Bitcoin’s perpetual futures market produced one of its rarest taker signals in years on June 11. Not during a volume surge. Not during a liquidation cascade. Just a quiet composition shift that placed the market in a statistical outlier that has appeared only 61 times across 2,354 daily readings since January 2020.
The Taker Buy/Sell Aggression Index registered a z-score of +2.084. Market composite long ratio came in at 0.5324. That number sits in the top 1.1% of all daily readings since 2020. Against a 30-day baseline of 0.4969 and a 7-day moving average of 0.5032, the deviation was sharp.
Long volume on June 11 reached $7.0 billiAon against short volume of $6.15 billion. Volume intensity sat at 0.975 — right at the 30-day mean. The aggression spike came from composition, not participation. That distinction matters more than the headline number.
Five Days of Selling Set the Table for This Flip
The week of June 1 through June 5 told a different story. Takers held consistent short positioning across five straight sessions while volume ran between 1.5x and 2.6x the 30-day average. Net short-side notional dominance across that window reached $3.37 billion. High participation, contained direction.

Source: CryptoQuant
Z-scores across that five-day window stayed muted. The range landed between -0.108 and -0.976. Broad sell pressure, not panicked liquidation. When volume runs hot but directional intensity stays low, the market tends to clear itself rather than signal a trend. That is what the data showed.
The cluster cleared. June 6 through June 10 saw participation normalize and the regime return to neutral. Then June 11 arrived. Short-term holders had already been sending coins to exchanges at a loss through this stretch — capitulation prints running at their worst readings of the year, per CryptoQuant data from early June. The environment entering June 11 was already fragile.
Sixth Time This Year – and Every Prior Instance Faded Fast
This was the seventh episode of Extreme Buy Aggression recorded in 2026. Historical frequency across the full 2,354-day dataset sits at 2.6%. The signal is rare by design. What happened to the prior six instances this year is the question that matters.
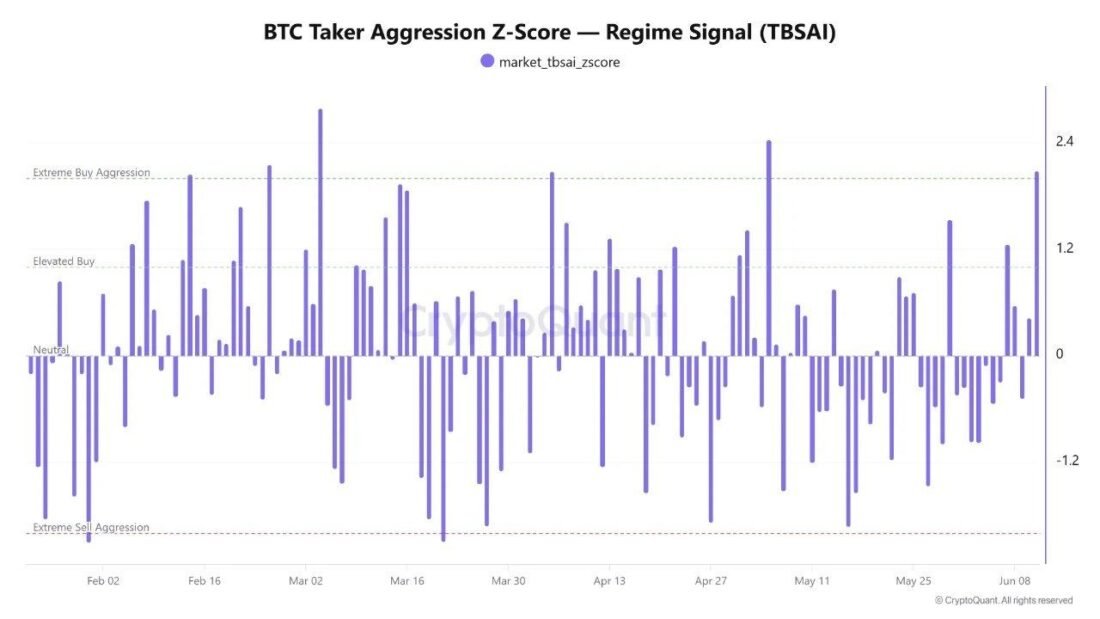
Source: CryptoQuant
In every prior 2026 instance, the z-score reverted toward neutral within 24 hours. Not one produced meaningful follow-through. CryptoQuant’s analysis was precise on the condition: at normalized volume intensity, takers are making a deliberate directional bet at ordinary market depth. Momentum behavior looks different. It shows up on elevated volume intensity, not at 0.975.
Demand readings on-chain had already hit a threshold seen only three times since 2019 heading into this week. Bitcoin spot ETFs recorded significant outflows through May and into June. The strongest long-side aggression signal since May 5 just appeared inside a macro backdrop that has not rewarded aggression this year.


Leave a Reply
You must be logged in to post a comment.