
XLM chart tightens into a coil as Stellar accounts cross 10.5M for the first time, but traders are split on whether a bear market breakout is real.
The coil on the XLM chart is getting tighter. That part at least seems clear. What happens next is where the agreement stops.
Crypto analyst CryptoPatel, on X, posted a biweekly Stellar chart showing the token sitting deep in an accumulation zone. The setup, per CryptoPatel, mirrors previous cycle lows.
The $5 Target Nobody Wants to Say Out Loud
CryptoPatel put a target zone of $5 to $10 on XLM. Most people, the post said, are still sleeping on it.
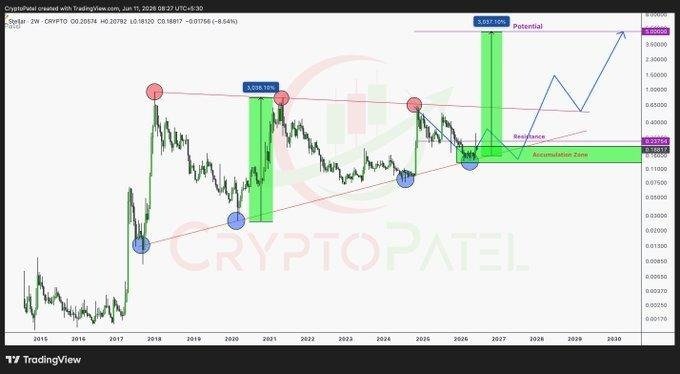
Source: CryptoPatel via X / TradingView
X Crowd Pushes Back Hard
The replies were not exactly a standing ovation. fDBYGGXCjQcF3H9, on X, wrote that coiling charts sound exciting until they don’t, pointing to too many past explosions that fizzled.
XLM has been mostly flat for a long stretch. xytng97374553, on X, said even half the $5 target would be wild for a token that has sat still so long. The $5 to $10 range, for a coin trading near its current levels, would be something closer to a 30x.
biiigbighen, on X, said charts can say anything until they don’t. Added that XLM at least has real use cases. More than most, apparently.
Stellar Accounts Cross 10 Million for the First Time
Separate from the price debate, the network itself is moving. ChartNerdTA, on X, posted data from stellar.expert showing Stellar accounts have crossed a new all-time high.

Source: ChartNerdTA via X / stellar.expert
The number, per that data, sits at 10,535,892. The chart shows a steep climb through late 2024 and into 2026.
Account growth and bear market price action do not always move together. Stellar grew its developer count 86% year over year in Q1, per Electric Capital data. The price has not followed at the same pace.
Skeptics Have Heard This Before
uxG5aeKINoDxEux, on X, said charts can coil all they want, but price action still comes down to adoption and market mood. The $5 to $10 range needs a real flood of retail money to work. That much is probably fair.
ssmm19951019, on X, said the consolidation is tight but it all feels like deja vu from the last cycle. Not ruling it out. Just noting that everyone has a crystal ball until it doesn’t work.
ke11erman_k_y, on X, put it more bluntly. Every cycle, the same claims get made about a dozen different coins. If it were that obvious, everyone would already be in.
One Voice Says Break and Hold
polygoldtrade_, on X, kept it short. XLM can break and hold above resistance with conviction. Left it at that.
mj_ontherun, on X, said tight coil patterns on other coins have gone both ways. Some break big. Others just fizzle. XLM has decent fundamentals but hitting $5 would need a whole new wave of adoption. Hard to argue with that.
XLM was trading near $0.182 at the time of writing. The biweekly chart CryptoPatel shared was created on June 11, 2026, UTC+5:30.


Leave a Reply
You must be logged in to post a comment.