
XRP trades near $1.08 after losing $1.261 support, while monthly RSI stays below 44 and daily RSI nears 18.
XRP monthly RSI continues to decline, keeping analysts focused on a possible final price flush before any macro bottom forms.
The daily chart shows XRP near $1.08 after losing key support, with $1.00 now in focus.
Analysts also track the 44 monthly RSI level as sentiment stays cautious across crypto assets for clearer market direction.
XRP Monthly RSI Stays Below Key Level
Market analysts are focused on XRP’s monthly RSI as it remains in a sharp decline. The indicator has not yet reclaimed the critical 44 level.
Traders see this level as a key marker for trend strength. A move back above 44 could improve the broader market analysis.
However, failure to regain that level may support more bearish continuation. For now, XRP has not shown clear monthly recovery signs.
#XRP – Monthly RSI In Free Fall… But That’s Exactly How Macro Bottoms Begin 🚨
This is what many fail to understand about #RSI structure on higher time frames.
At major bear market bottoms:
✅ Price often prints a LOWER LOW
while
✅#RSI begins forming a HIGHER LOW
✅That… pic.twitter.com/tS5b95nQqi— EGRAG CRYPTO (@egragcrypto) June 6, 2026
Some analysts are watching for hidden bullish divergence on higher time frames. This happens when price makes a lower low, while RSI forms a higher low.
The pattern can appear near large market bottoms.
EGRAG CRYPTO said, “Fear creates bottoms. Divergence confirms them.” The same view added, “Structure > Emotion.” Traders are now waiting for RSI to stabilize before calling a macro shift.
XRP Price Breaks Below Fibonacci Support
On the daily chart, XRP is trading near $1.08 against the U.S. dollar. The asset has dropped below the $1.261 Fibonacci level.
That zone had marked the full retracement of a previous major move. The break below $1.261 has weakened the short-term structure.
Sellers remain in control while XRP stays under that level. A daily close back above it would be needed to ease pressure.
The $1.00 level is now the main support area for traders. It is also a key psychological level in the market. If XRP loses $1.00, the next support may sit near $0.90 to $0.95.
Resistance is now seen near $1.261, which has turned into a barrier. Above that, traders are watching $1.59, $1.85, and $2.03. These levels match key Fibonacci zones on the chart.
Read Also:
XRP Dominance Is Holding Key Support-Is Volatility Coming Next?
RSI and MACD Show Bearish Momentum
The daily RSI is near 18, placing XRP in deeply oversold territory. This shows strong selling pressure across the short-term chart.
It may also allow relief bounces if buyers return. However, oversold readings do not confirm a bottom alone.
Price still needs to reclaim resistance for a stronger recovery signal. Until then, bounces may remain limited.
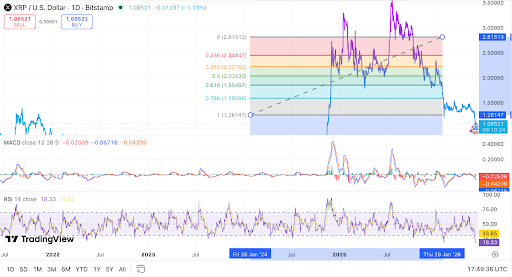
The MACD also remains below the zero line. This keeps bearish momentum active on the daily chart.
The signal lines have not yet shown a clear bullish shift. For now, traders are watching two main signals.
The first is whether XRP holds the $1.00 support area. The second is whether monthly RSI begins forming a higher low. XRP remains in a weak technical setup after losing major support.
Still, some traders believe a final flush could help build a base. Confirmation would depend on price stability and an RSI recovery above 44.


Leave a Reply
You must be logged in to post a comment.