 Samuel·15hr ago
XRP price is consolidating above $0.5150 against the US Dollar, like Bitcoin. It must stay above the $0.5050 support to continue higher in the near term.
After forming a base above the $0.4750 level, XRP price started a fresh increase against the US Dollar. The XRP/USD pair broke the $0.4850 and $0.500 resistance levels to enter a positive zone.
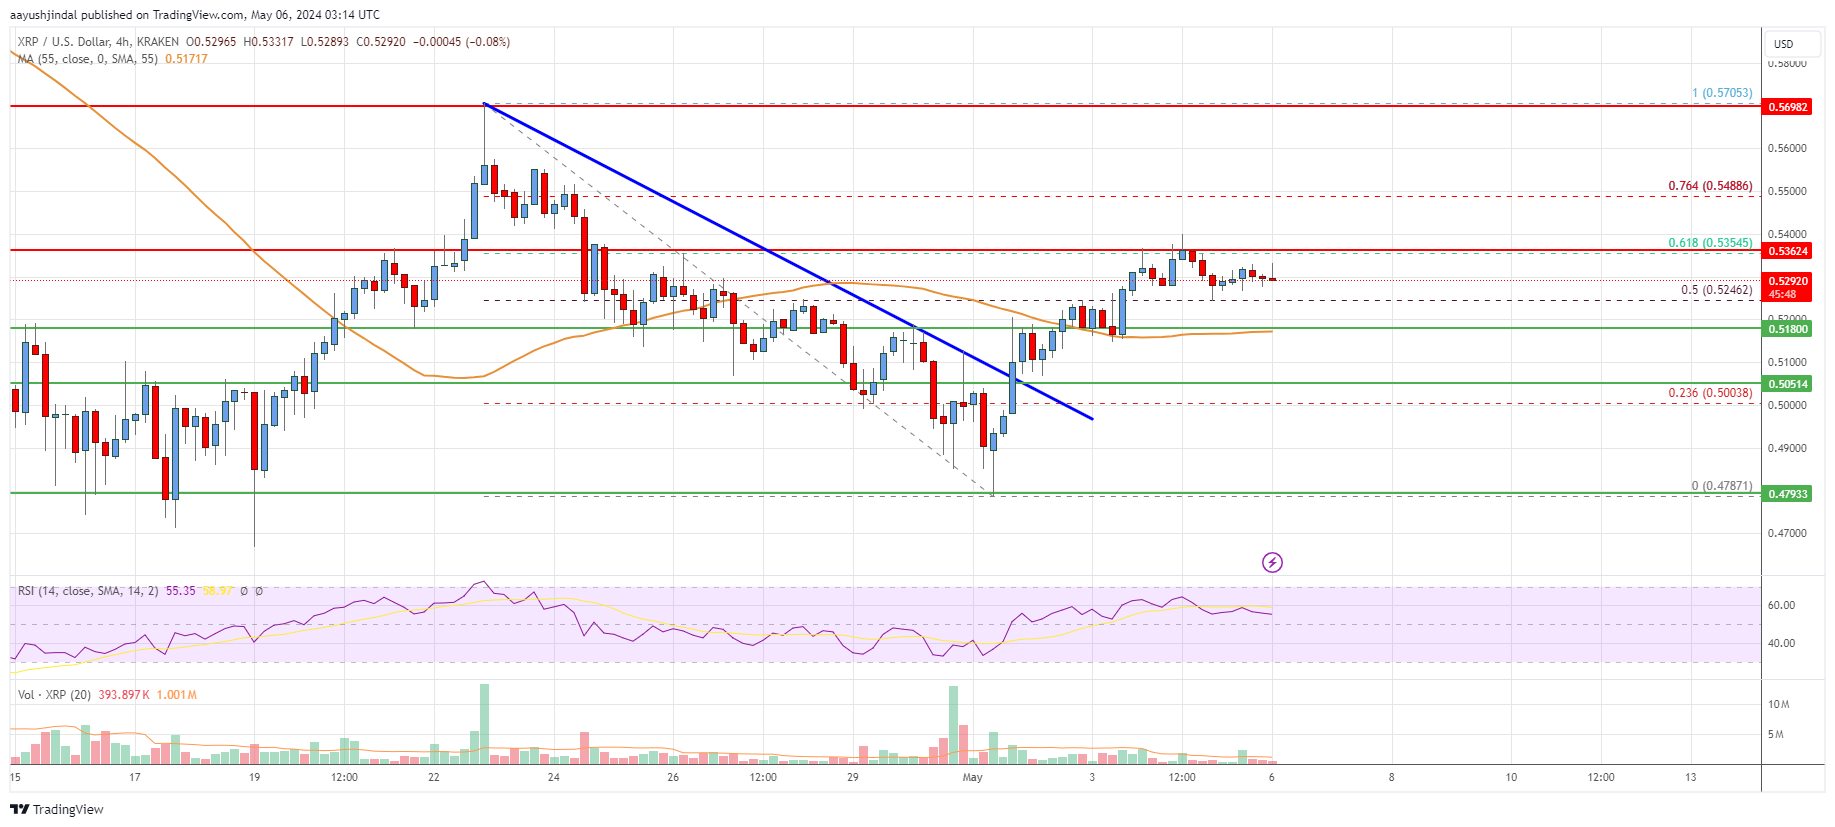
There was a break above a key bearish trend line with resistance at $0.5050 on the 4-hour chart of the XRP/USD pair. The pair even cleared the 50% Fib retracement level of the downward wave from the $0.5705 swing high to the $0.4787 low.
The price is now trading above $0.5150 and the 55 simple moving average (4 hours). On the upside, the price is facing resistance near $0.5350. It is near the 61.8% Fib retracement level of the downward wave from the $0.5705 swing high to the $0.4787 low.
The first key resistance is near the $0.5420 level. The next major resistance is near the $0.550 level. A clear move above the $0.550 resistance zone might start a strong increase. In the stated case, the price could even surpass the $0.570 zone and test $0.600. Any more gains might send the price toward the $0.620 resistance.
Initial support on the downside is near the $0.5180 level. The next major support is near the $0.5050 level. Any more losses could lead the price toward the $0.4850 level, below which the price might even test the $0.4780 support zone in the near term.
Looking at the chart, XRP price is now trading above the $0.5150 zone and the 55 simple moving average (4 hours). Overall, the price could start a fresh increase above the $0.5350 resistance.
4 hours MACD – The MACD for XRP/USD is now losing momentum in the bullish zone.
4 hours RSI (Relative Strength Index) – The RSI for XRP/USD is above the 50 level.
Key Support Levels – $0.5180, $0.5050, and $0.480.
Key Resistance Levels – $0.5350 and $0.5700.
Related News
Explore more