- XRP price started a fresh decline from the $0.658 resistance against the US dollar.
- The price is now trading below $0.625 and the 55 simple moving average (4 hours).
- There is a key bearish trend line forming with resistance near $0.619 on the 4-hour chart of the XRP/USD pair (data source from Bittrex).
- The pair could extend losses if it breaks the $0.584 support zone.
XRP price is struggling below $0.650 against the US Dollar, unlike Bitcoin. The price could decline further if it settles below the $0.584 support in the near term.
XRP Price Analysis
In the past few hours, Ripple’s XRP price started a fresh decline from well above $0.650 against the US Dollar. The XRP/USD pair stayed below the $0.632 level and extended its decline.
The bears were able to push the price below the $0.625 support. The pair broke the 50% Fib retracement level of the upward move from the $0.5954 swing low to the $0.6578 high. XRP is now trading below $0.625 and the 55 simple moving average (4 hours).
Initial support on the downside is near $0.610 or the 76.4% Fib retracement level of the upward move from the $0.5954 swing low to the $0.6578 high. The next major support is near the $0.598 level. The main support sits at $0.584.
Any more losses could lead the price toward the $0.560 level, below which the price might even test $0.520. On the upside, the price is facing resistance near $0.620. There is also a key bearish trend line forming with resistance near $0.619 on the 4-hour chart of the XRP/USD pair.
The next major resistance is near the $0.632 level. A clear move above $0.632 might start a fresh increase. In the stated case, the price could even surpass the $0.650 resistance. Any more gains might send the price toward the $0.680 resistance.
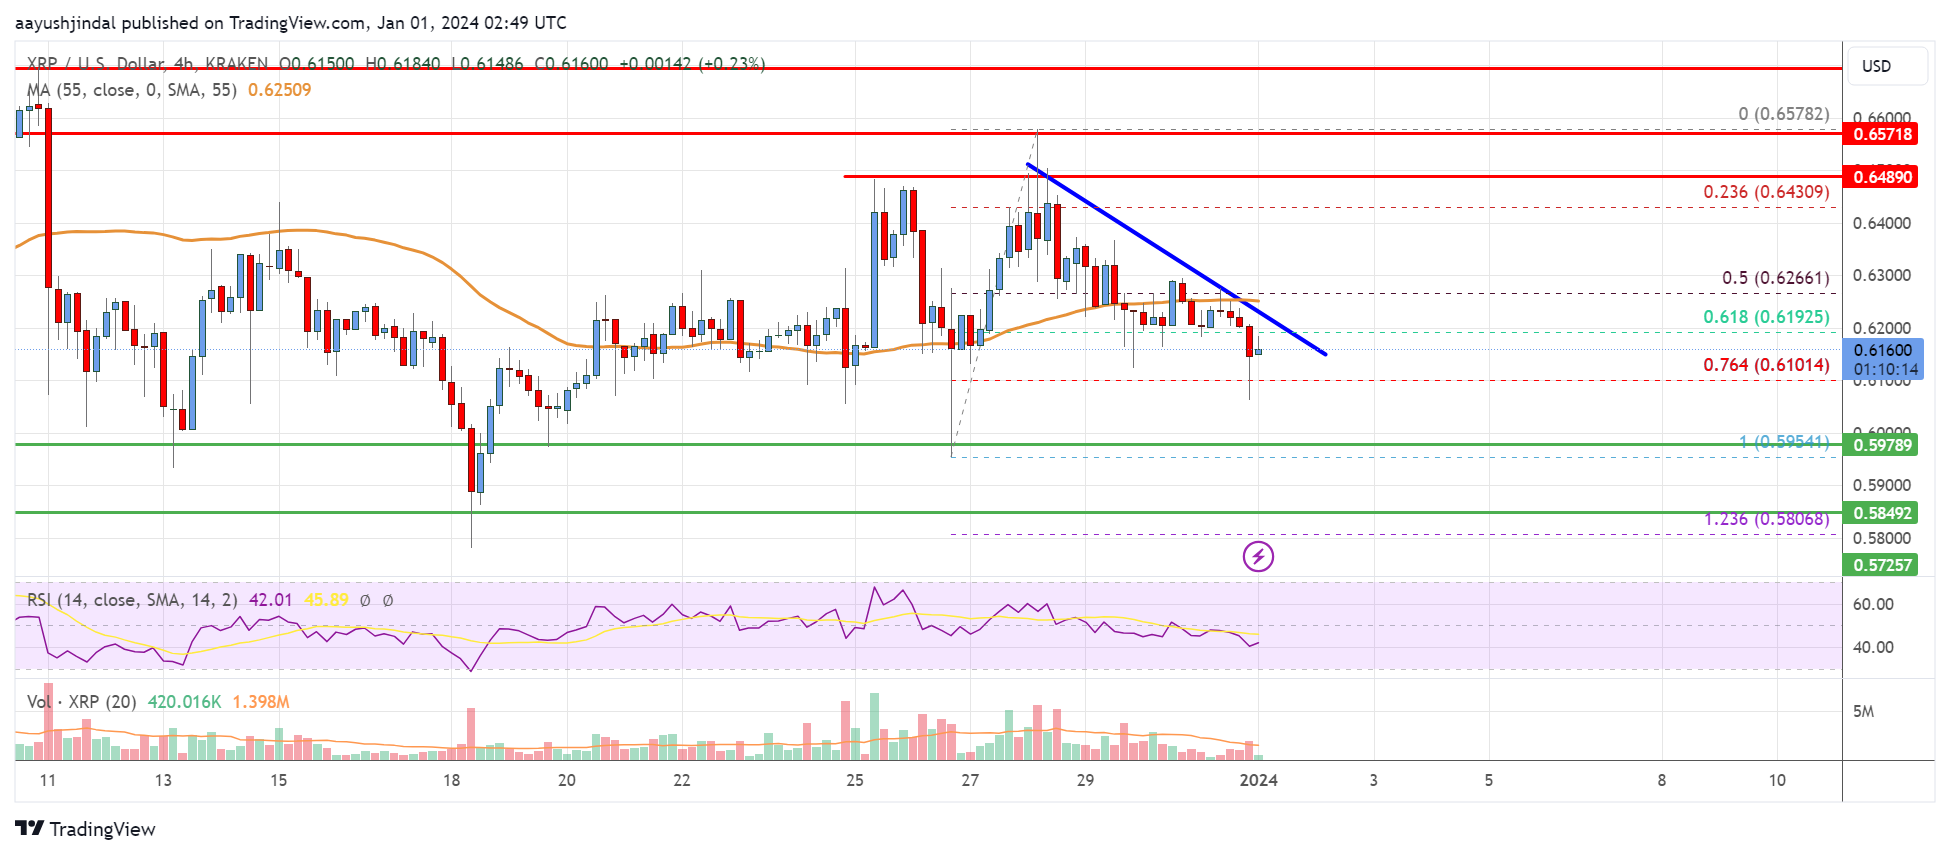
Looking at the chart, XRP price is now trading below the $0.625 zone and the 55 simple moving average (4 hours). Overall, the price could extend losses if it breaks the $0.584 support zone.
Technical indicators
4 hours MACD – The MACD for XRP/USD is now gaining momentum in the bearish zone.
4 hours RSI (Relative Strength Index) – The RSI for XRP/USD is below the 50 level.
Key Support Levels – $0.610, $0.592, and $0.584.
Key Resistance Levels – $0.620 and $0.632.