
XRP trades near $1.41 after losing the $1.70 level, with RSI, MACD, and key support zones shaping its next move.
XRP traded near $1.41 as market debate returned over whether the asset remains undervalued after its latest pullback.
The token sits below key resistance, yet traders continue to watch technical levels, adoption claims, and market sentiment for signs of a larger move.
Market Debate Returns Around XRP Value
XRP analysts continues to point to earlier market cycles. In 2017, XRP traded near $0.006 before reaching above $3 in 2018.
Some traders now compare that move with the recent rise from $0.50 to $2.60 in late 2024. The latest market discussion also focuses on the $1.10 to $0.70 area.
Some traders describe this zone as an accumulation range. However, price action still needs confirmation from daily closes.
They Called $XRP "Dead" in 2023 – Now $10 Is Closer Than You Think
2017: XRP at $0.006 → "$3 is a fantasy"
2018: Hit $3+ ✅2023: "XRP is dead" 💀
Nov 2024: $0.50 → $2.60 in 30 days ✅Today: $1.40+
Accumulation Zone: $1.10-$0.70$10–$20? Absolutely on the table.
$100?… pic.twitter.com/A4MgO4WPfZ— Crypto Patel (@CryptoPatel) May 4, 2026
According to crypto patel XRP is faster than Bitcoin and cheaper than Ethereum.
They also state that XRP is used by banks worldwide. These claims remain part of the wider market debate around utility.
Targets between $10 and $20 continue to circulate among bullish traders. Yet the chart still shows that $1.70 is the first key barrier.
A move above that level may shift focus back toward $2 and higher zones.
XRP Price Holds Below a Key Breakout Zone
XRP is currently trading near $1.41 on the daily chart. The price remains below the lower end of a key Fibonacci range near $1.7066.
This level had acted as support during the prior range. The break below $1.70 has weakened the current market structure.
A daily close above $1.70 could show that buyers are regaining control. Until then, rallies may remain limited.
Immediate resistance sits near $1.50 to $1.55. This area has become the first test for short-term buyers. Above that, the $1.7066 level remains the main level to watch.
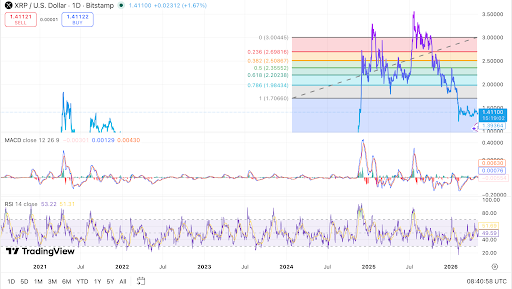
If XRP reclaims $1.70, the next upside levels sit at $1.98, $2.20, and $2.35. Higher targets include $2.51, $2.70, and the prior range high near $3.00.
On the downside, support is seen near $1.35 to $1.40. A daily close below this zone may bring $1.20 to $1.25 into focus. The $1.00 level also remains a key psychological area.
Read Also:
XRP Consolidation Signals Major Move as ETF Inflows Stay Strong
Momentum Signals Show a Mixed Market
The MACD remains weak, but it has started to flatten. This shows that selling pressure may be slowing. However, the indicator has not confirmed a strong bullish reversal.
The RSI is moving near the neutral zone. It is shown around the low 50s on the daily chart.
This suggests that XRP is not oversold, but momentum is not strong yet. A move above 55 to 60 on the RSI could support a bullish case.
A drop below 45 may show that sellers are gaining strength again. The broader trend remains under pressure after XRP fell from the $3 area.
The price also failed to hold several mid-range Fibonacci levels. That keeps traders focused on confirmation before expecting a larger recovery.


Leave a Reply
You must be logged in to post a comment.