- Bitcoin cash price is trading above the main $290 support area against the US Dollar.
- The price is currently testing a major resistance area near the $312 level.
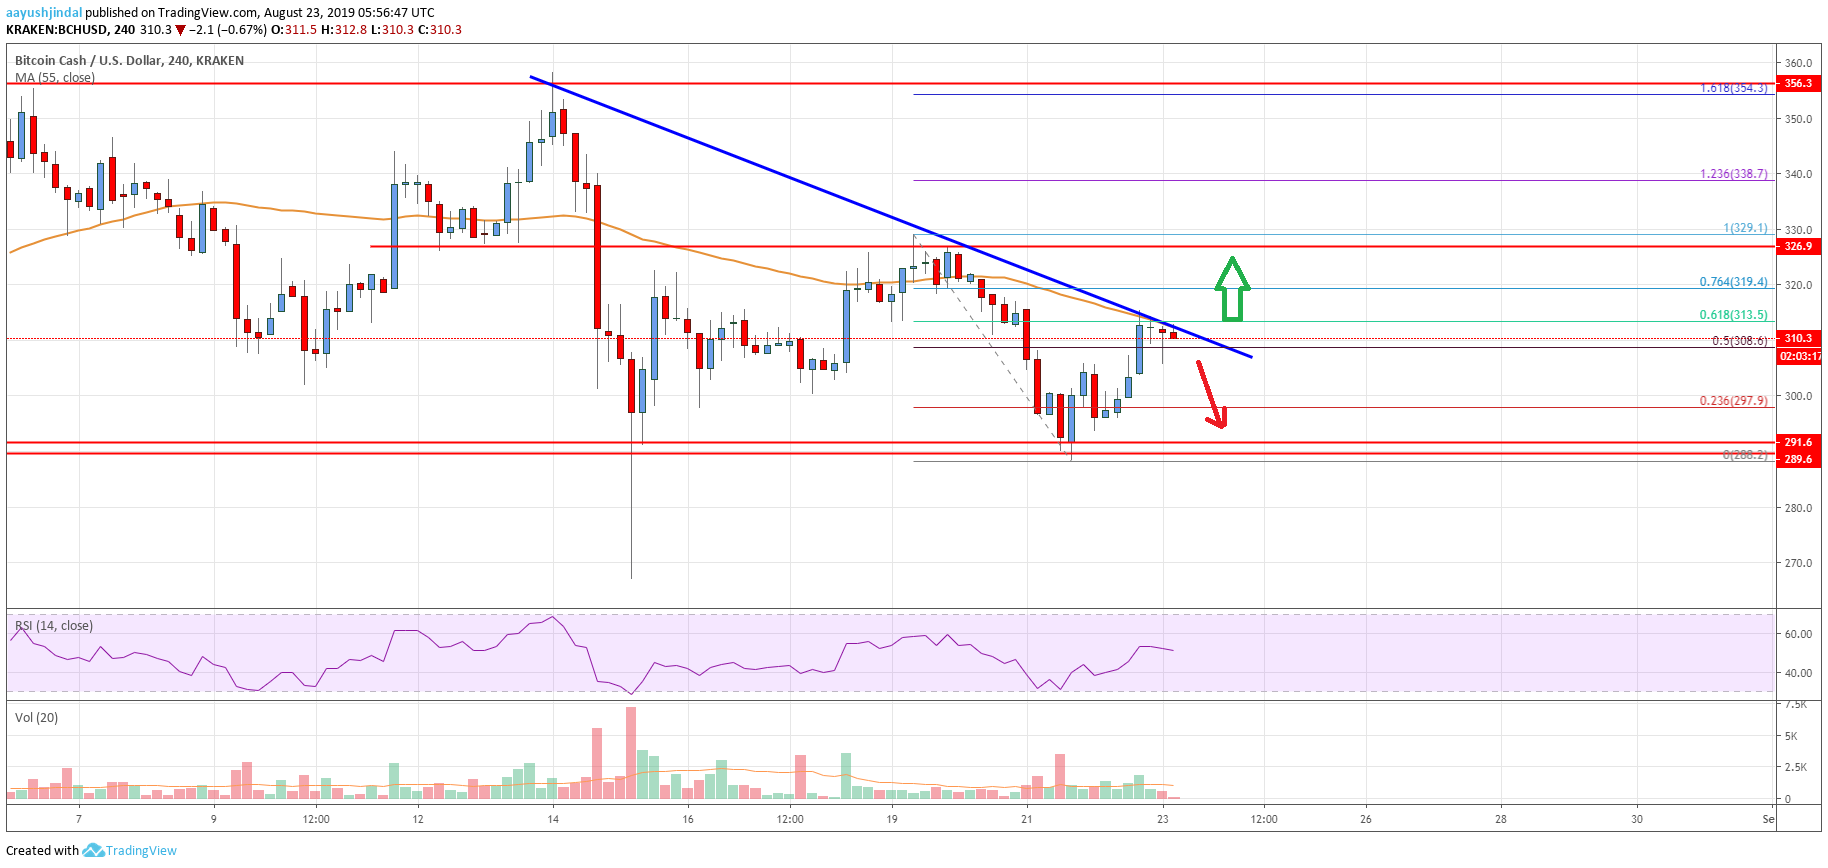
- There is a crucial bearish trend line forming with resistance near $313 on the 4-hours chart of the BCH/USD pair (data feed from Kraken).
- The pair is likely to surge higher if its breaks the $313 and $315 resistance levels.
Bitcoin cash price is eyeing a major upside break above $315 against the US Dollar. If BCH fails to climb above $315, it could resume its decline below $300.
Bitcoin Cash Price Analysis
In the past few days, bitcoin cash price mostly traded in a broad range below the $325 resistance against the US Dollar. The BCH/USD pair declined below the $300 support level and the 55 simple moving average (4-hours). However, the $288-$290 support area acted as a strong buy zone. The bears struggled to gain momentum below $290 and the price recovered recently.
A swing low was formed near $288 and the price climbed above $295. Moreover, there was a break above the $300 and $305 resistance levels. The price surpassed the 50% Fib retracement level of the recent decline from the $329 high to $288 low. However, the price seems to be facing a strong resistance near the $313 and $315 levels. Additionally, there is a crucial bearish trend line forming with resistance near $313 on the 4-hours chart of the BCH/USD pair.
The 61.8% Fib retracement level of the recent decline from the $329 high to $288 low is also acting as a resistance. Finally, the 55 simple moving average (4-hours) is near the trend line and $313. Therefore, an upside break above $313 and $315 might start a strong surge towards the $325 resistance level. If there are more upsides above $325, the next stop for the bulls may be $345.
Conversely, if the price fails to climb above $313 and $315, it could retreat towards $300. The main support is near the $288-290 zone, below which the price will most likely start a significant downward move. The next stop for the bears might be near the $270 level.
Looking at the chart, bitcoin cash price is clearly preparing for the next break either above $315 or towards $290. The current price action suggests high chances of an upside break above $315 and $320 in the near term.
Technical indicators
4 hours MACD – The MACD for BCH/USD is losing momentum in the bullish zone.
4 hours RSI (Relative Strength Index) – The RSI for BCH/USD is currently just above the 50 level.
Key Support Levels – $300 and $290.
Key Resistance Levels – $315 and $325.