- Bitcoin cash price is under a lot of pressure as it broke the $288 support against the US Dollar.
- The price is currently trading near a major support at $269, with a bearish angle.
- There are two major bearish trend lines forming with resistance near $280 and $290 on the 4-hours chart of the BCH/USD pair (data feed from Kraken).
- The pair remains at a risk of more losses below the $269 support area.
Bitcoin cash price is facing an increase in selling below $280 against the US Dollar. BCH/USD might extend its decline towards the $260 support area in the near term.
Bitcoin Cash Price Analysis
Recently, bitcoin cash price failed to break the $300 resistance area against the US Dollar. As a result, BCH price started a downward move and broke the $288 support area to move into a short term bearish zone.
Moreover, there was a close below the $286 support and the 55 simple moving average (4-hours). It opened the doors for more losses below the $280 and $276 support levels.
At the moment, the price is trading near the $269 support area. If there is a downside break below the $269 support, there is a risk of more losses below the $265 level. The next major support is near the $258 zone, below which there is a risk of more losses.
On the upside, an initial resistance is near the $276 area. Besides, the 23.6% Fib retracement level of the recent decline from the $300 high to $269 low is also near the $276 level.
More importantly, there are two major bearish trend lines forming with resistance near $280 and $290 on the 4-hours chart of the BCH/USD pair. Above the first trend line, the $186 level is a strong resistance.
Additionally, the 50% Fib retracement level of the recent decline from the $300 high to $269 low is likely to act as a resistance near the $285-$286 zone. To move into a positive zone, the price must clear the $286 resistance and the 55 simple moving average (4-hours).
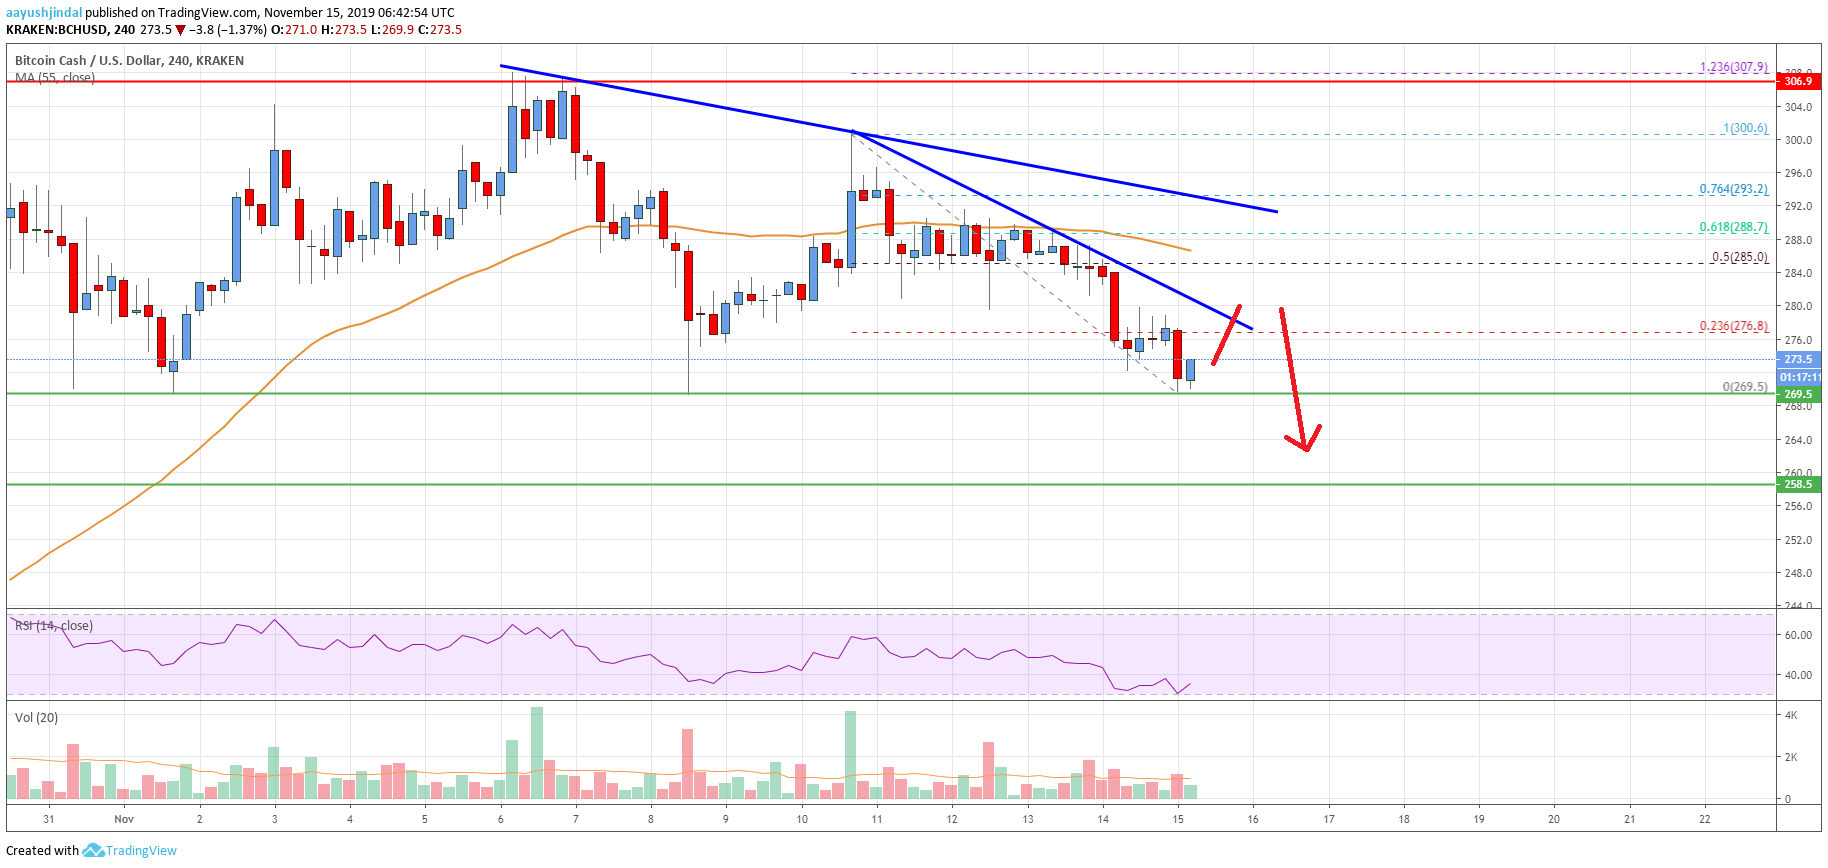
Looking at the chart, bitcoin cash price is clearly trading near a major support at $269. If it fails to stay above $270 and $269, there could be an extended decline towards the $260 area. On the upside, a clear break above $280 and $286 is needed for a fresh upward move in the near term.
Technical indicators
4 hours MACD – The MACD for BCH/USD is currently losing momentum in the bearish zone.
4 hours RSI (Relative Strength Index) – The RSI for BCH/USD is currently recovering from the 30 level.
Key Support Levels – $269 and $258.
Key Resistance Levels – $280 and $286.
