- Bitcoin cash price is declining and it recently broke the $238 support area against the US Dollar.
- The price is struggling to recover and it seems like it may even break the $215 support.
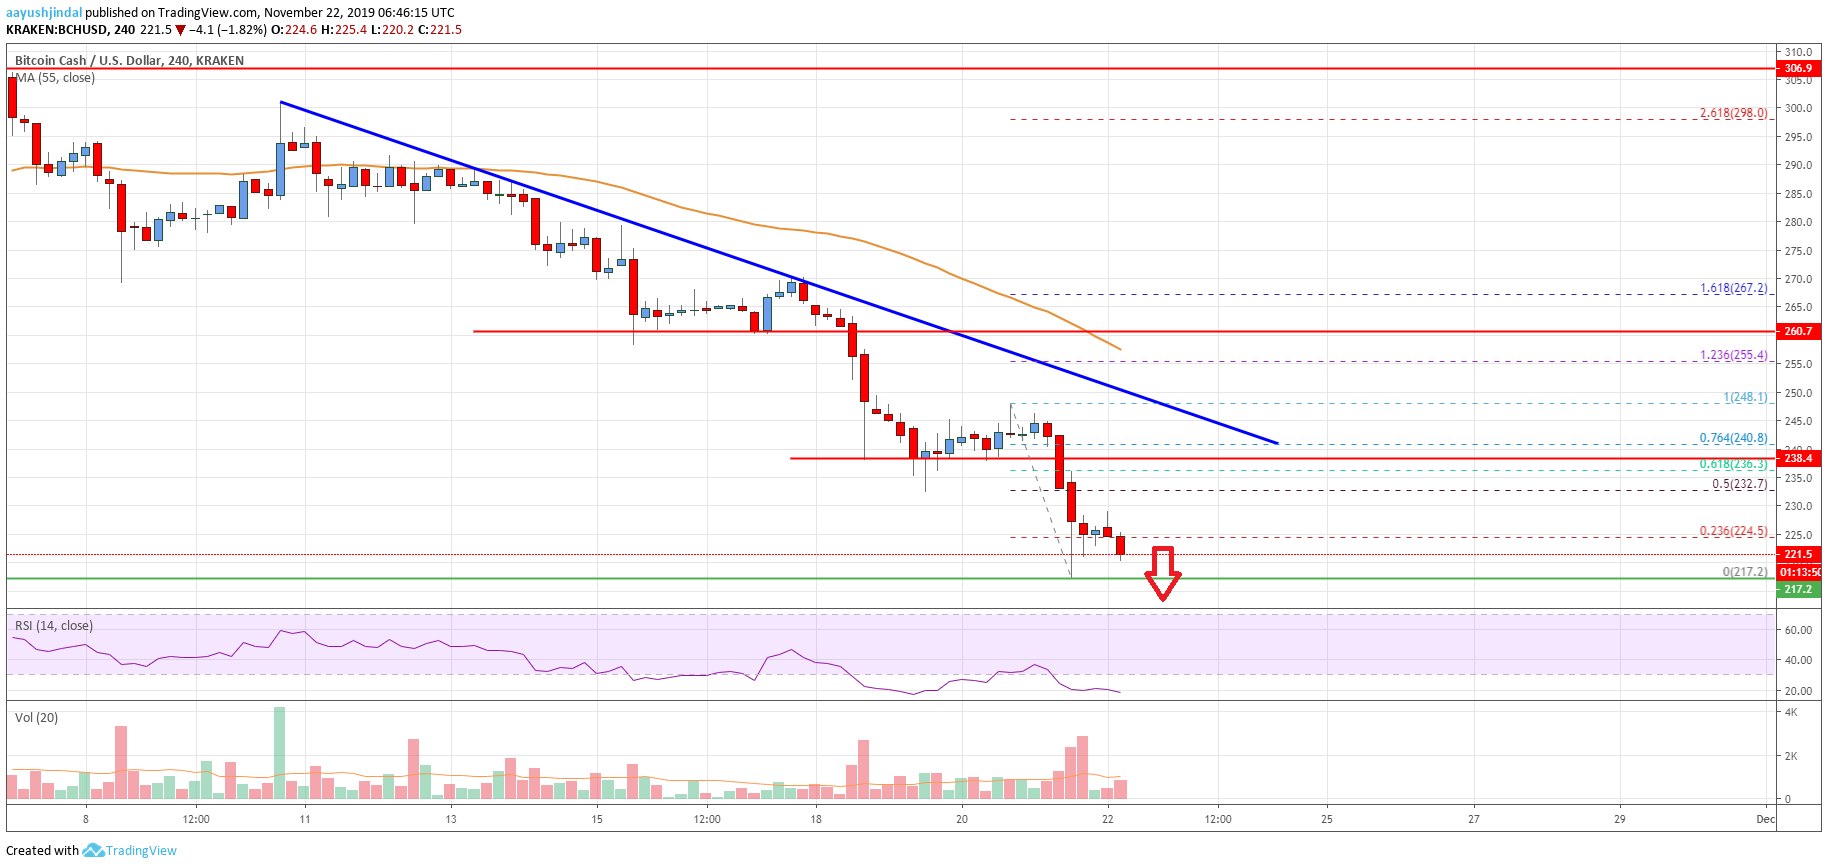
- There is a key bearish trend line forming with resistance near $240 on the 4-hours chart of the BCH/USD pair (data feed from Kraken).
- The pair remains at a risk of more losses towards the main $200 support area.
Bitcoin cash price is tumbling below $238 and $220 against the US Dollar. BCH/USD is likely to test the $200 support area, where the bulls might take a stand.
Bitcoin Cash Price Analysis
In the past few days, there was a steady decline in bitcoin cash price after it failed to break the $300 resistance area against the US Dollar. BCH price broke many supports near the $260 level to enter a bearish zone.
Moreover, there was a close below the $238 support and the 55 simple moving average (4-hours). Finally, the price moved below the $225 support level and traded to a new monthly low near the $217 level.
Recently, there was a minor upside correction above the $220 level. However, the price struggled to settle above the 23.6% Fib retracement level of the recent decline from the $247 high to $217 low.
On the upside, there are many resistances near the $232 and $238 levels. The first key resistance is near the $232 level since it coincides with the 50% Fib retracement level of the recent decline from the $247 high to $217 low.
Besides, the main resistance is near the $238 and $240 levels. More importantly, there is a key bearish trend line forming with resistance near $240 on the 4-hours chart of the BCH/USD pair.
Therefore, an upside break above the $238 and $240 levels is needed for a decent recovery in the near term. Conversely, bitcoin cash price may perhaps continue to move down below $215.
The next major support area is near the $200 handle, where the bulls might emerge. Any further losses possibly will really set panic and the price could drop towards $150.

Looking at the chart, bitcoin cash price is clearly declining heavily below the $238 and $225 levels. The price is likely to test the main $200 support, which holds the key. On the upside, the bulls need to gain strength above $238 and $240.
Technical indicators
4 hours MACD – The MACD for BCH/USD is currently gaining momentum in the bearish zone.
4 hours RSI (Relative Strength Index) – The RSI for BCH/USD is currently in the extreme oversold region.
Key Support Levels – $215 and $200.
Key Resistance Levels – $225 and $238.


Leave a Reply
You must be logged in to post a comment.