- Bitcoin cash price is struggling to recover above $600 and $620 against the US Dollar.
- The price is now trading below $600 and the 55 simple moving average (4-hours).
- There is a key bearish trend line forming with resistance near $620 on the 4-hours chart of the BCH/USD pair (data feed from Coinbase).
- The pair could extend its decline unless there is a clear break above $600 and $620.
Bitcoin cash price is struggling to recover above $620 against the US Dollar, similar to bitcoin. BCH/USD remains at a risk of more downsides below $560.
Bitcoin Cash Price Analysis
After struggling above $700, bitcoin cash price started a fresh decline. BCH broke the $620 support level and the 55 simple moving average (4-hours) to move into a bearish zone.
There was also a break below the $600 level. The price traded as low as $545 and it recently started an upside correction. There was a break above the $580 level. The price traded above the 23.6% Fib retracement level of the key drop from the $735 high to $545 low.
The price even climbed above the $620 level. However, it failed to clear the $640 resistance level. It seems like the price was rejected near the 50% Fib retracement level of the key drop from the $735 high to $545 low.
There is also a key bearish trend line forming with resistance near $620 on the 4-hours chart of the BCH/USD pair. The pair is now trading below $600 and the 55 simple moving average (4-hours). If the price continues to stay below $600, there is a risk of more losses.
An initial support on the downside is near the $575 level. The next major support is near the $550 level, below which bitcoin cash price could dive towards the $510 level. Conversely, a clear break above $620 is must to start a steady increase. The next key resistance is near $650.
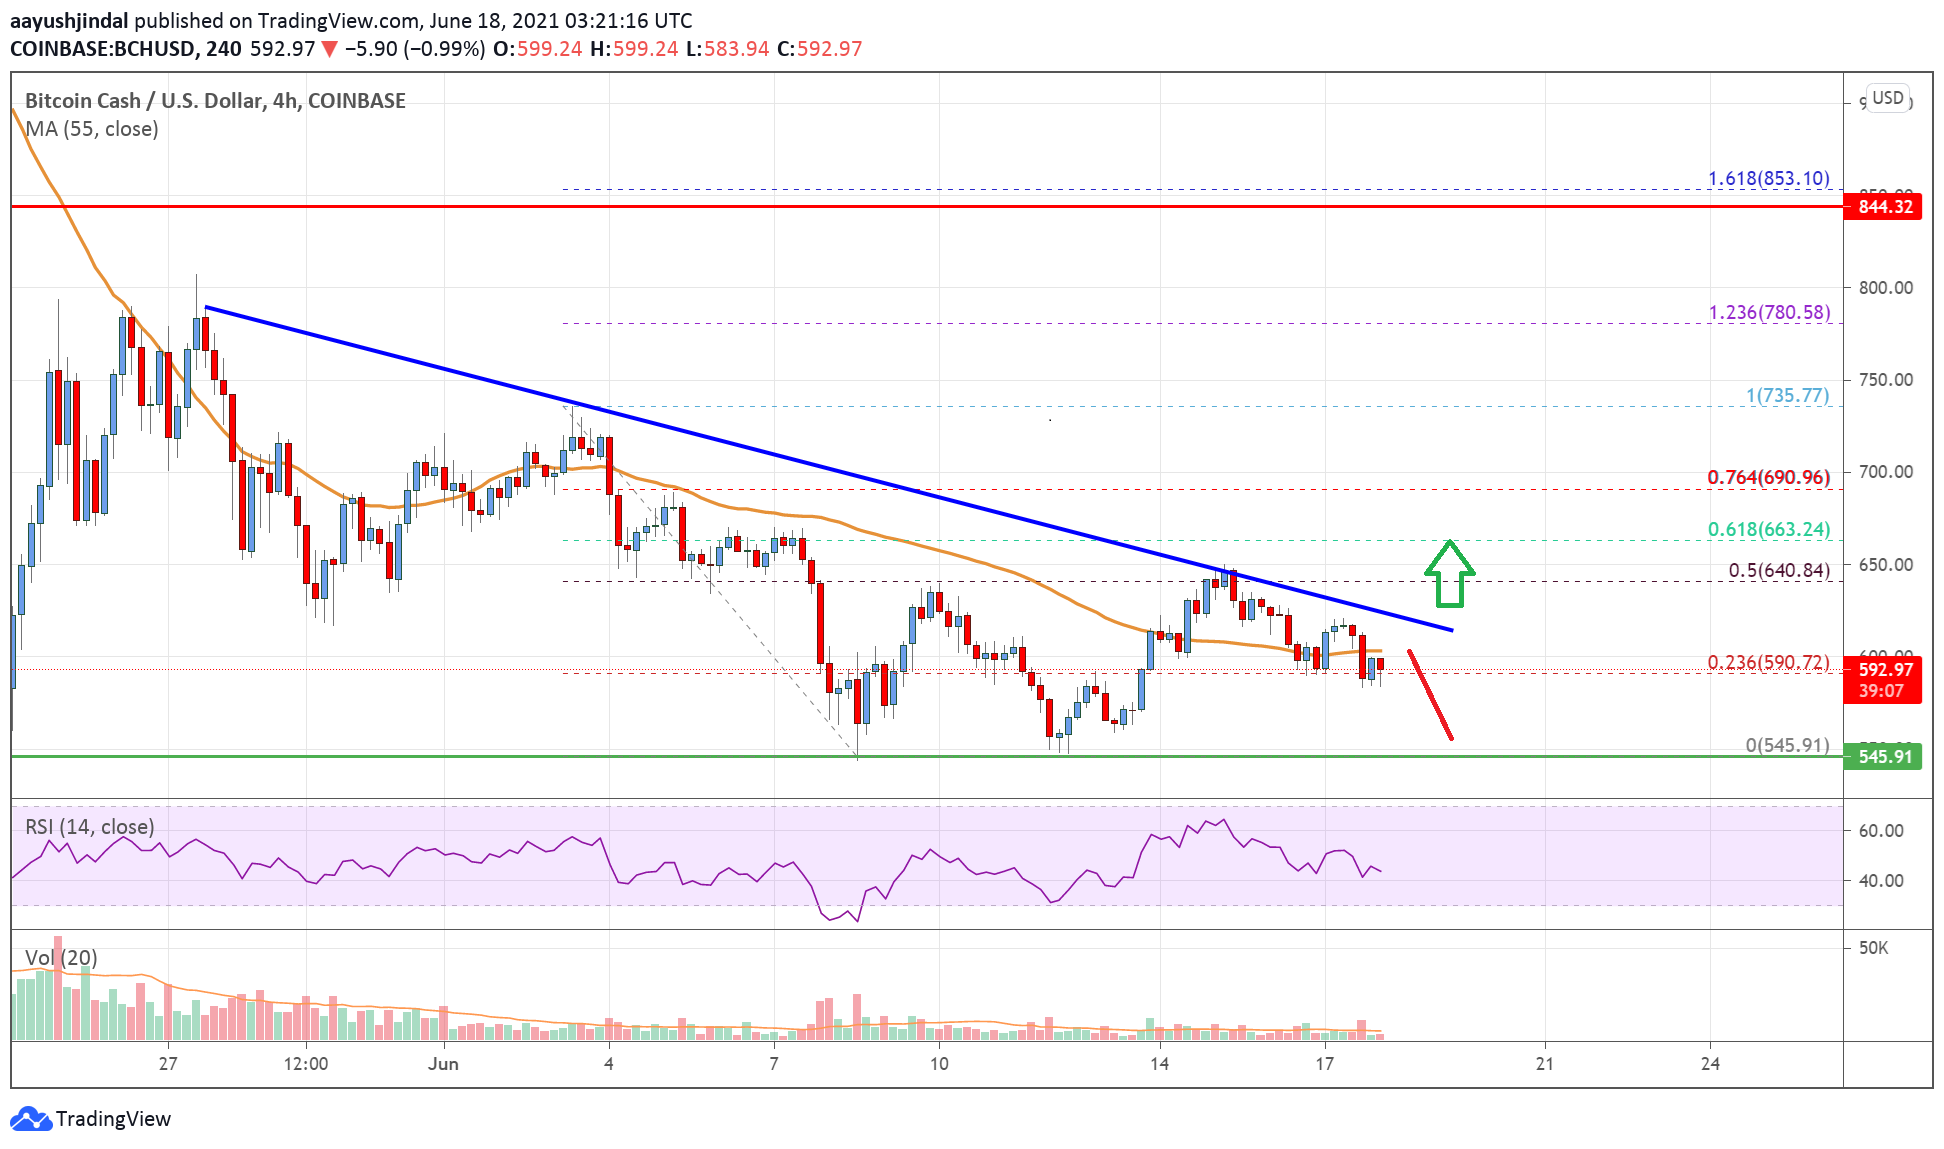
Looking at the chart, bitcoin cash price is clearly trading below $600 and the 55 simple moving average (4-hours). Overall, the price is could extend its decline unless there is a clear break above $600 and $620.
Technical indicators
4 hours MACD – The MACD for BCH/USD is now gaining pace in the bearish zone.
4 hours RSI (Relative Strength Index) – The RSI for BCH/USD is below the 50 level.
Key Support Levels – $550 and $500.
Key Resistance Levels – $600 and $620.