
- Bitcoin cash price started a fresh increase from the $500 support zone against the US Dollar.
- The price is now trading well above the $520 level and the 55 simple moving average (4-hours).
- There was a break above a key bearish trend line with resistance near $500 on the 4-hours chart of the BCH/USD pair (data feed from Coinbase).
- The pair is showing a lot of positive signs and it is likely to accelerate higher towards $600.
Bitcoin cash price is gaining pace above $525 and $540 against the US Dollar, similar to bitcoin. BCH/USD could continue to rise towards $600 and $610 in the near term.
Bitcoin Cash Price Analysis
After a downside correction, bitcoin cash price formed a strong support base near the $450 level. BCH price traded as low as $442 before it started a fresh increase.
It broke many important hurdles near the $500 resistance and the 55 simple moving average (4-hours). There was a break above the 61.8% Fib retracement level of the downward move from the $550 swing high to $442 low.
Moreover, there was a break above a key bearish trend line with resistance near $500 on the 4-hours chart of the BCH/USD pair. The pair is now trading well above the $520 level and the 55 simple moving average (4-hours). It even cleared the $550 swing high.
An immediate resistance is near the $575 level. It is near the 1.236 Fib extension level of the downward move from the $550 swing high to $442 low. A clear break above the $575 resistance could set the pace for a move towards the $600 and $610 resistance levels.
Conversely, there could be a downside correction below the $550 level. An initial support is near the $540 level. The first major support is near the $525 level. The main support is now forming near the $500 level and the 55 simple moving average (4-hours).
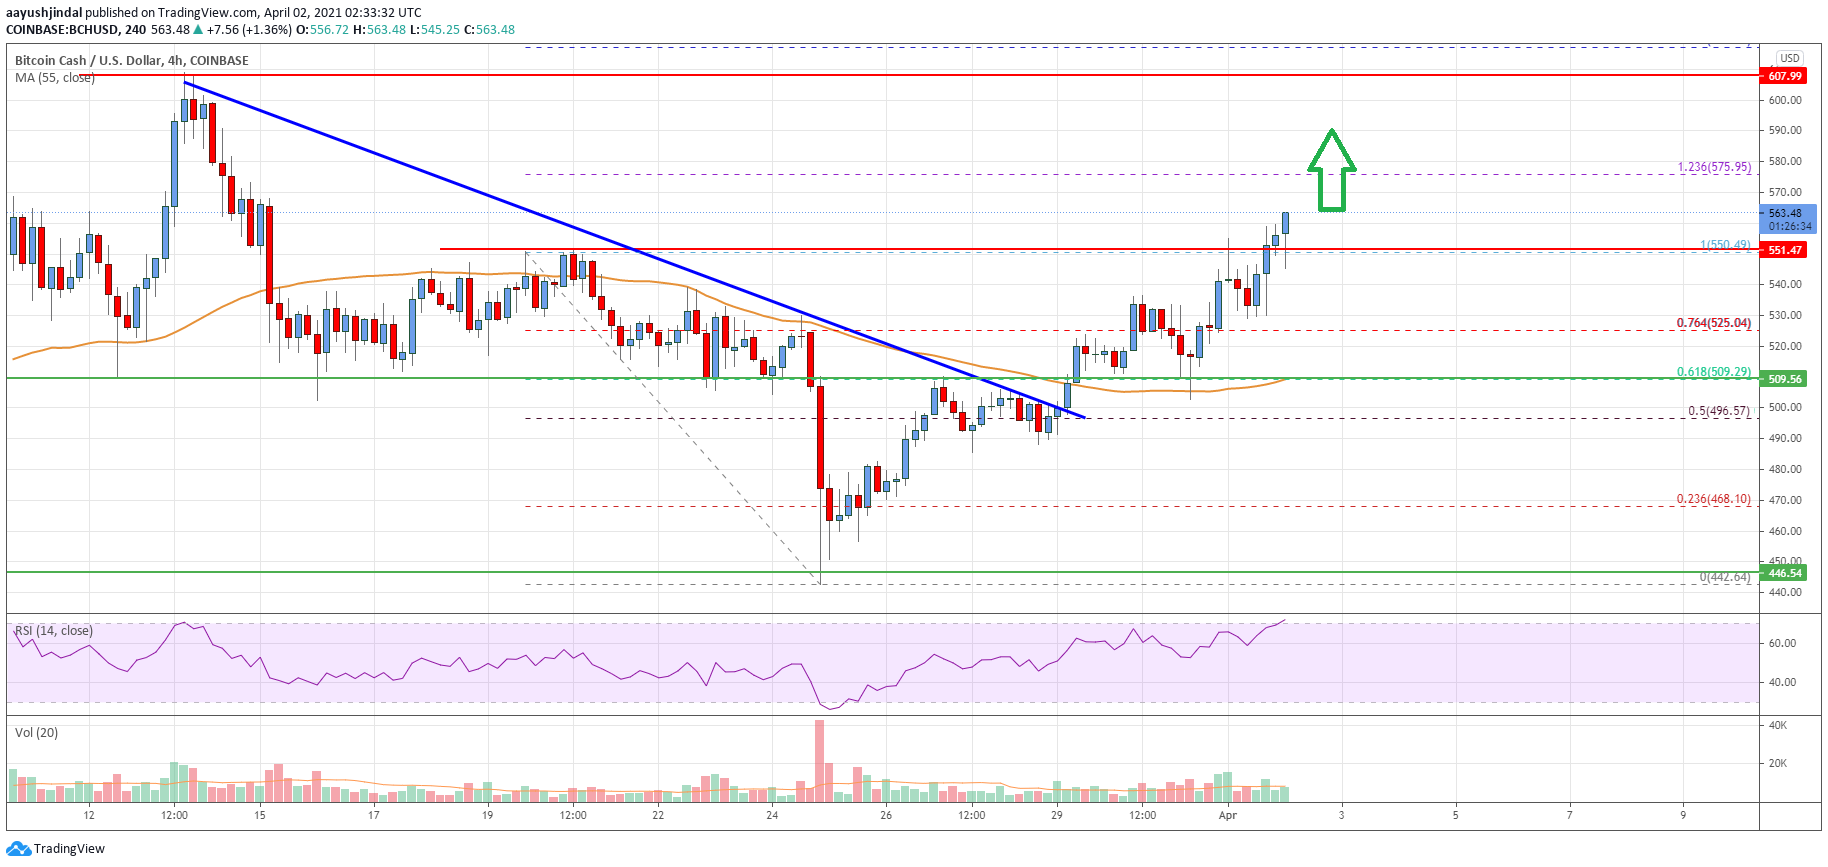
Looking at the chart, bitcoin cash price is clearly trading well above the $500 level and the 55 simple moving average (4-hours). Overall, the price is showing a lot of positive signs and it is likely to accelerate higher towards $600.
Technical indicators
4 hours MACD – The MACD for BCH/USD is now gaining pace in the bullish zone.
4 hours RSI (Relative Strength Index) – The RSI for BCH/USD is well above the 50 level.
Key Support Levels – $525 and $500.
Key Resistance Levels – $575 and $600.


Leave a Reply
You must be logged in to post a comment.