- Bitcoin cash price is facing a strong resistance near the $720 level against the US Dollar.
- The price is now trading just below $700 and the 55 simple moving average (4-hours).
- There is a key bearish trend line forming with resistance near $730 on the 4-hours chart of the BCH/USD pair (data feed from Coinbase).
- The pair could extend its decline below $650 if it remains below the $750 resistance zone.
Bitcoin cash price is struggling to recover above $700 against the US Dollar, similar to bitcoin. BCH/USD must surpass $750 to move back into a positive zone.
Bitcoin Cash Price Analysis
After forming a base above the $500 level, bitcoin cash price started a steady recovery. BCH recovered above the $550 and $650 levels, but the bulls are clearly facing many hurdles.
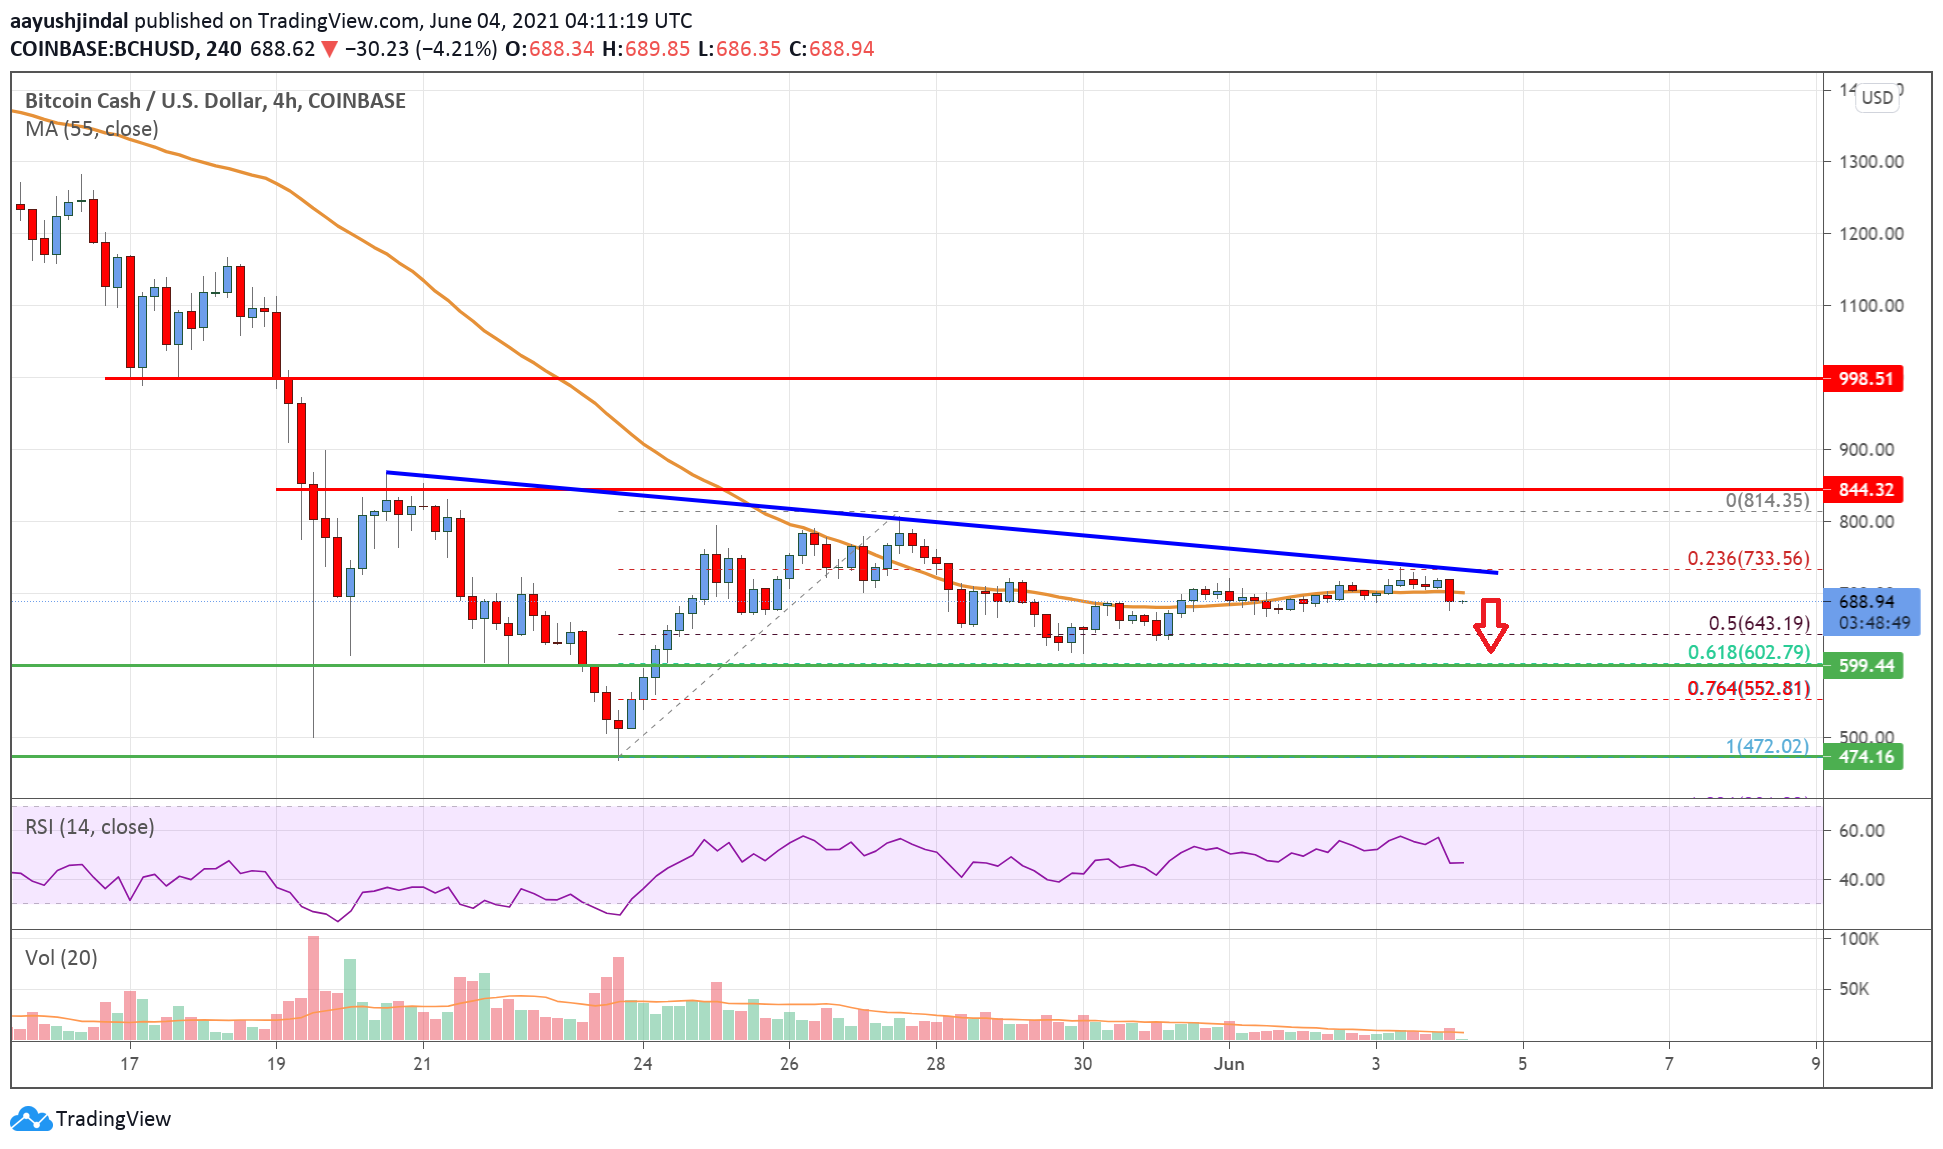
The price topped near the $800 level and it even failed to settle above the 55 simple moving average (4-hours). There was a fresh decline below the $750 support zone. The price traded below the 23.6% Fib retracement level of the upward move from the $472 swing low to $824 high.
There is also a key bearish trend line forming with resistance near $730 on the 4-hours chart of the BCH/USD pair. The pair is now trading just below $700 and the 55 simple moving average (4-hours).
It tested the 50% Fib retracement level of the upward move from the $472 swing low to $824 high. If the price remains below the $700 zone, there is a risk of more losses.
An initial support on the downside is near the $650 level. The next major support is near the $600 level, below which bitcoin cash price could dive towards the $500 level. An immediate resistance on the upside is near the $720 level.
The first major resistance is near the $750 level. A clear upside break above the $750 level could lead the price towards $850. Any more gains might call for a test of the $1,000 level.
Looking at the chart, bitcoin cash price is clearly trading just below $700 and the 55 simple moving average (4-hours). Overall, the price is could extend its decline below $650 if it remains below the $750 resistance zone.
Technical indicators
4 hours MACD – The MACD for BCH/USD is now losing pace in the bullish zone.
4 hours RSI (Relative Strength Index) – The RSI for BCH/USD is just below the 50 level.
Key Support Levels – $650 and $600.
Key Resistance Levels – $750 and $850.
