- Bitcoin price is struggling to clear the $34,000 and $35,000 resistance levels against the US Dollar.
- The price is now trading well below $34,000 and the 55 simple moving average (4-hours).
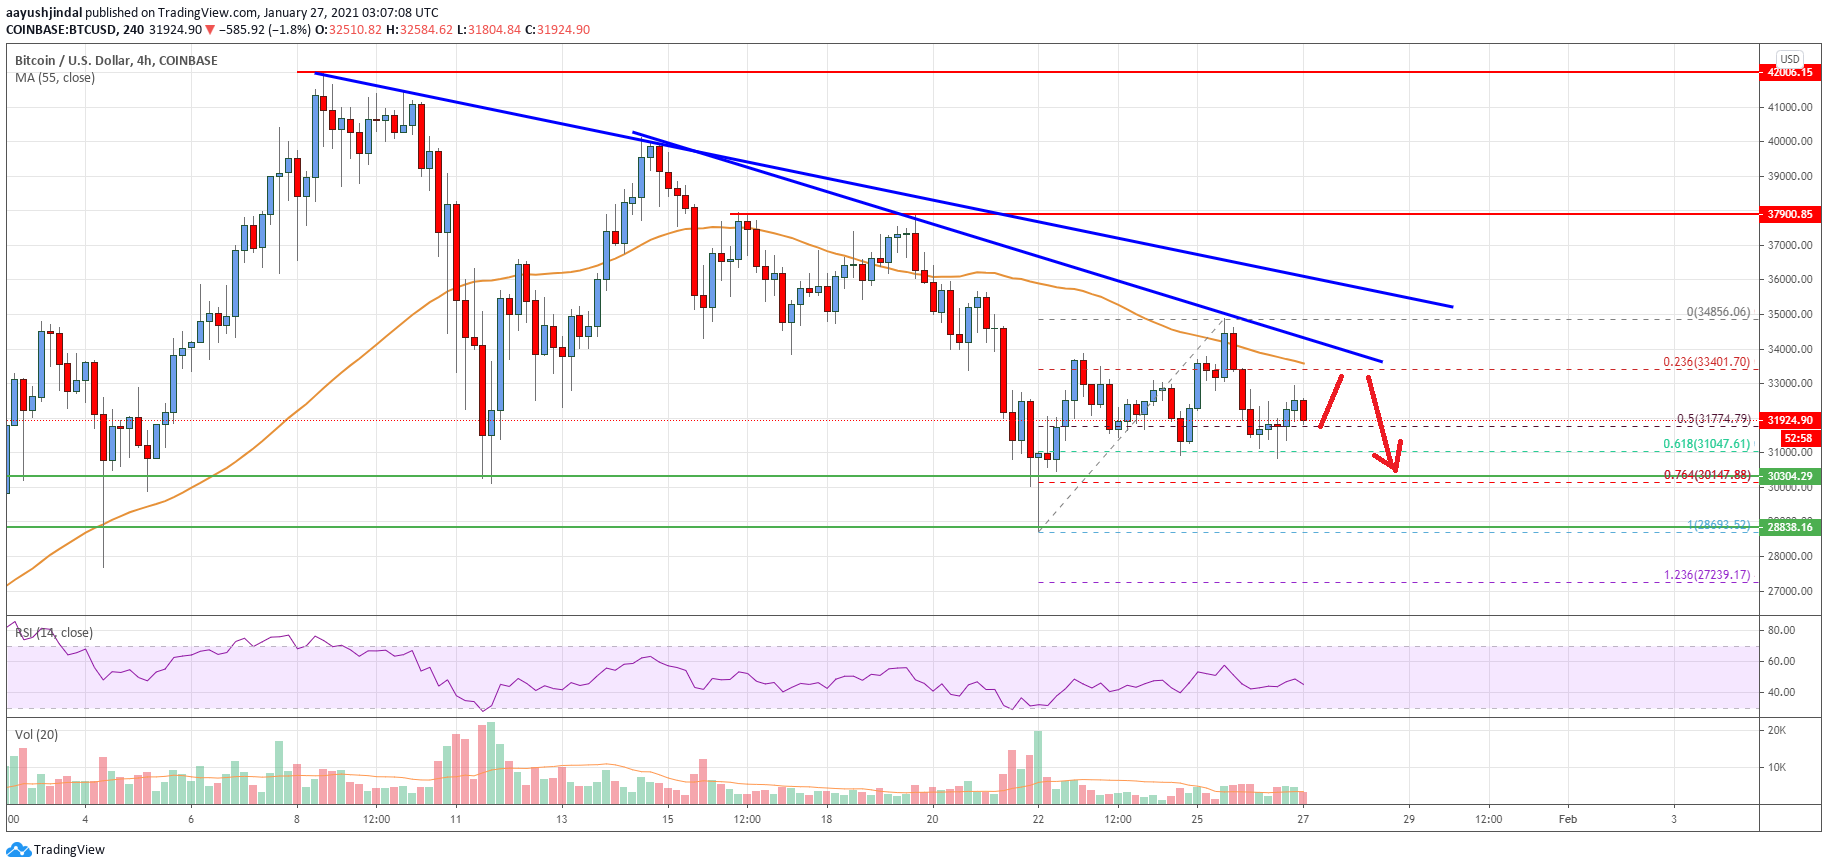
- There are two major bearish trend lines forming with resistance near $34,000 and $34,800 on the 4-hours chart of the BTC/USD pair (data feed from Coinbase).
- The pair could decline sharply if it fails to stay above the $30,000 support zone.
Bitcoin price is showing a few bearish signs below $35,000 against the US Dollar. BTC is at a risk of a sharp decline if there is no recovery above $34,000 in the near term.
Bitcoin Price Analysis
In the past few days, there was a bearish wave in bitcoin price below $38,200 against the US Dollar. BTC broke the $35,000 and $34,000 support levels to move into a bearish zone.
The price even broke the $32,000 support level and settled below the 55 simple moving average (4-hours). A low was formed near $28,693 before the price started an upside correction. There was a recovery wave above $32,500 and $33,500.
However, the price struggled to clear the $35,000 resistance and it stayed below the 55 simple moving average (4-hours). A high is formed near $34,856 and the price is currently declining.
There was a break below the 50% Fib retracement level of the upward move from the $28,693 swing low to $34,856 high. Bitcoin price is now holding the $31,000 support level, but it seems to be facing many hurdles on the upside.
There are also two major bearish trend lines forming with resistance near $34,000 and $34,800 on the 4-hours chart of the BTC/USD pair. To move into a positive zone, the pair must clear the $34,000 and $35,000 resistance levels.
On the downside, the 61.8% Fib retracement level of the upward move from the $28,693 swing low to $34,856 high is at $31,000. The main support is near the $30,000 level. A daily close below $30,000 could open the doors for a larger decline.

Looking at the chart, bitcoin price is clearly trading well below $34,000 and the 55 simple moving average (4-hours). Overall, the price could decline sharply if it fails to stay above the $30,000 support zone.
Technical indicators
4 hours MACD – The MACD is now gaining momentum in the bearish zone.
4 hours RSI (Relative Strength Index) – The RSI is now below the 50 level.
Key Support Levels – $31,000 and $30,000.
Key Resistance Levels – $34,000, $34,800 and $35,000.


Leave a Reply
You must be logged in to post a comment.