- Bitcoin price jumped higher recently and broke the $3,475 resistance area against the US Dollar.
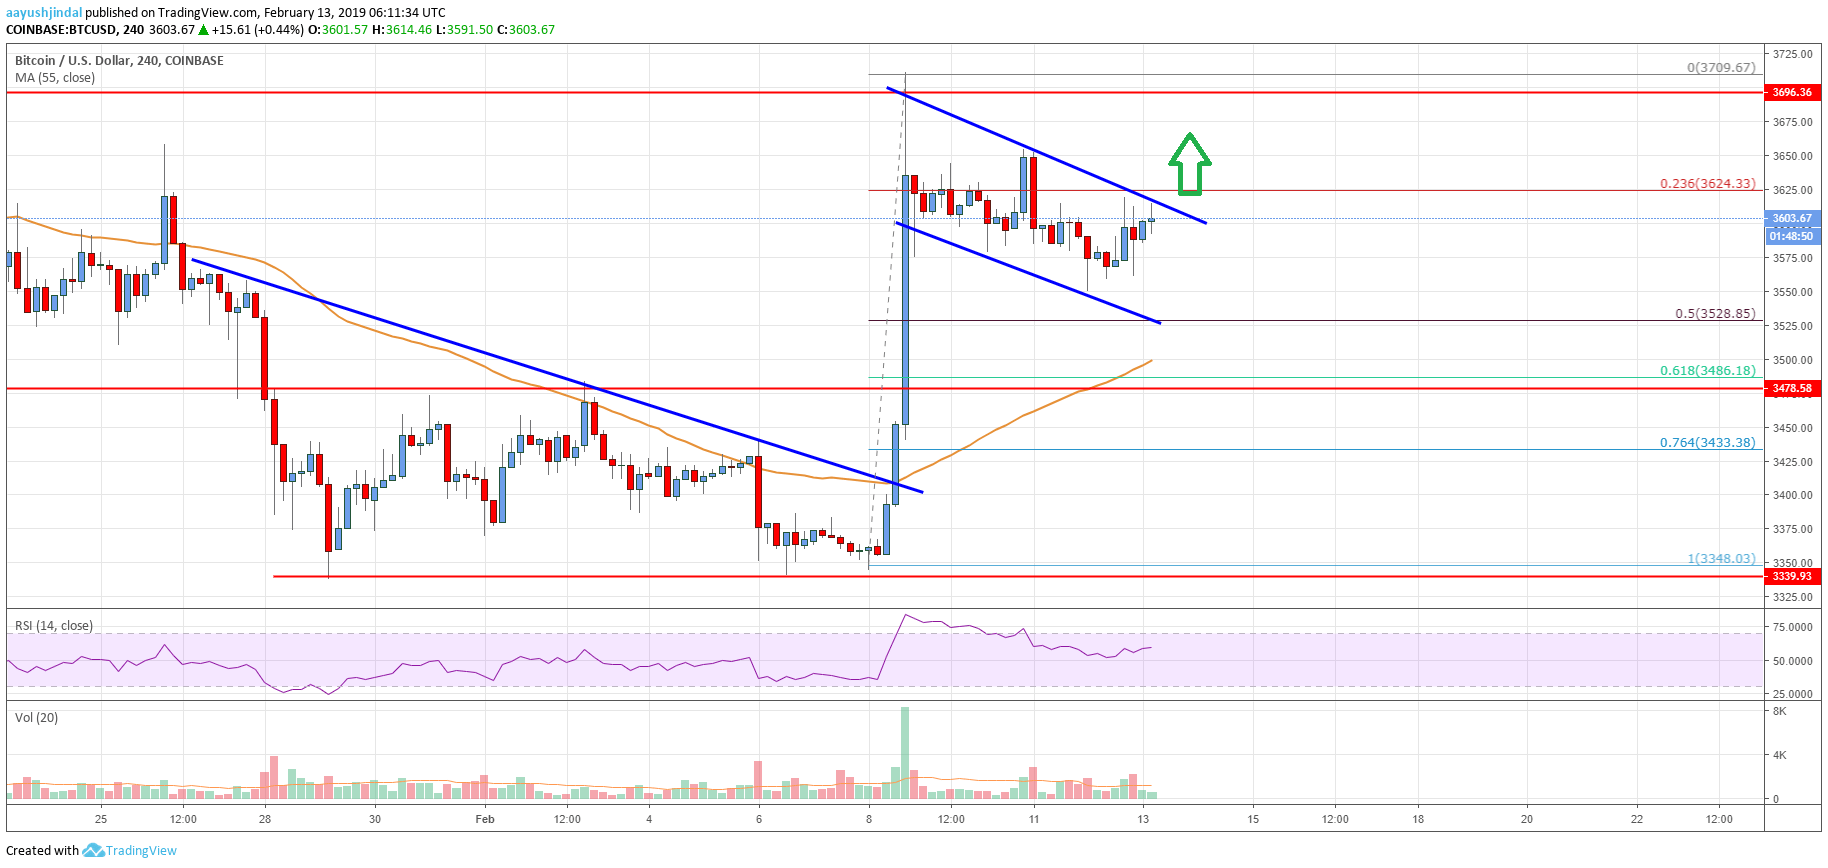
- There is a crucial bullish flag pattern formed with resistance at $3,605 on the 4-hours chart of the BTC/USD pair (data feed from Coinbase).
- The price is likely to break the $3,605 and $3,625 resistance to resume its upward move in the near term.
Bitcoin price is currently trading in an uptrend above the $3,525 support against the US Dollar. BTC could continue to rise if there is a break above the $3,625 resistance area.
Bitcoin Price Analysis
After testing the $3,350 support on a few occasions, bitcoin price started a solid upward move against the US Dollar. The BTC/USD pair rallied above the $3,400 and $3,475 resistance levels. It moved into a bullish zone and settled above the $3,500 resistance plus the 55 simple moving average (4-hours). More importantly, there was a break above a significant bearish trend line at $3,410 on the 4-hours chart of the BTC/USD pair. The pair climbed higher sharply and traded above $3,700.
A high was formed at $3,709 and later the price started a downside correction. Sellers push the price below the 23.6% Fib retracement level of the recent wave from the $3,348 low to $3,709 high. However, the $3,560 level acted as a decent support. At the outset, there is a crucial bullish flag pattern formed with resistance at $3,605 on the same chart. Therefore, a clear break above the flag resistance and $3,625 might call for more gains in the near term. In the stated bullish scenario, the price could rally above the $3,680 and $3,700 resistance levels.

Looking at the chart, bitcoin price is placed nicely in an uptrend above the $3,560 and $3,500 support levels. If there is an extended downside correction, the price might find support near $3,550 or the 55 simple moving average (4-hours). The main targets for buyers could be $3,750 and $3,880.
Technical indicators
4-hour MACD – The MACD is placed nicely with positive signs in the bullish zone.
4-hour RSI (Relative Strength Index) – The RSI is moving higher towards the 65 level, with a bullish angle.
Key Support Level – $3,550
Key Resistance Level – $3,625


Leave a Reply
You must be logged in to post a comment.