- Bitcoin price rallied recently after it broke the $3,600 resistance zone against the US Dollar.
- There was a break above a major bullish flag pattern with resistance at $3,600 on the 4-hours chart of the BTC/USD pair (data feed from Coinbase).
- The pair surged above the $3,800 resistance and formed a new monthly high at $3,968.
- A downside correction is underway, but dips remain supported near the $3,700 support in the near term.
Bitcoin price surged higher above $3,700 and $3,800 against the US Dollar. BTC traded above $3,950 and later started a downside correction towards $3,760 and $3,710 supports.
Bitcoin Price Analysis
This past week, there was a strong rise towards the $3,700 level in bitcoin price against the US Dollar. Later, the BTC/USD pair started consolidating gains with corrective moves below $3,700. It tested the $3,550 support area, where it found renewed buying interest. As a result, there was a fresh rally and the price climbed above the $3,600 and $3,700 resistance levels. More importantly, there was a break above a major bullish flag pattern with resistance at $3,600 on the 4-hours chart of the BTC/USD pair.
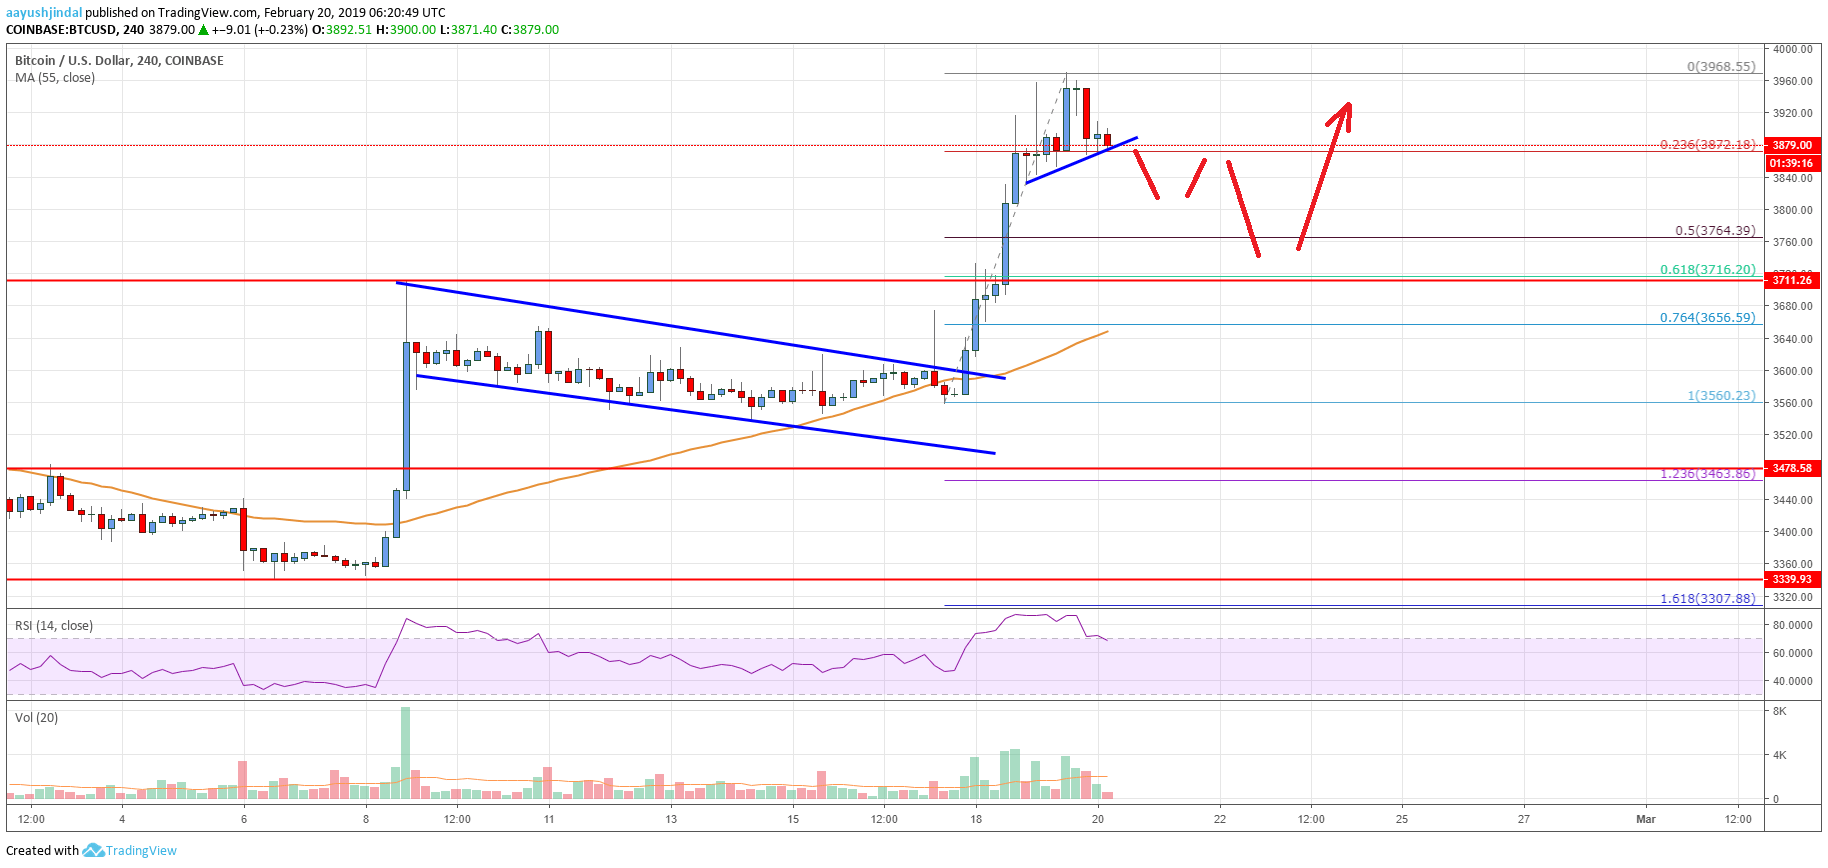
The pair settled above the $3,800 level and the 55 simple moving average (4-hours). Buyers pushed the price above the $3,900 and $3,950 levels. However, there was no test of the $4,000 resistance and later the price corrected lower. It declined below $3,900 and tested the 23.6% Fib retracement level of the recent wave from the $3,560 low to $3,968 high. At the moment, the price is trading near the $3,880 support and a connecting bullish trend line on the same chart.
If there is a downside break below the trend line, the price might decline towards the $3,710 support area. An intermediate support is near the $3,765 level. It represents the 50% Fib retracement level of the recent wave from the $3,560 low to $3,968 high. At the outset, it seems like the price might break the $3,880 and $3,850 support levels to start a substantial downside correction.

Looking at the chart, bitcoin price clearly gained traction above the $3,800 level. However, it failed to surpass the $3,950 and $4,000 resistance levels. Therefore, there is a risk of a downside correction towards the $3,710 support before a fresh upward move. On the upside, the main resistances are seen near $3,950, $4,000 and $4,060.
Technical indicators
4 hour MACD – The MACD is currently reducing its bullish slope, with a few bearish signs.
4 hour RSI (Relative Strength Index) – The RSI is moving lower from the overbought levels and it could test the 60 level.
Key Support Levels – $3,765 and 3,710.
Key Resistance Levels – $3,950 and 4,000.


Leave a Reply
You must be logged in to post a comment.