Bitcoin price is at $66,700 and on-chain data is flashing cheap across most metrics. The exception is leverage, which is doing something unusual for a cycle low.
Wallets that have not moved in months are still not moving. Exchange inflows from short-term holders have dried up. Miner revenue is running low for this stage of the cycle. Against that backdrop, bitcoin price is sitting somewhere around $66,700, which puts the drawdown from last October at roughly 47%.
The cheap signals are almost everywhere. Almost is the problem. Leverage, specifically the ratio of open derivatives positions to exchange coin holdings, is near the top of its range for this entire cycle. That combination is the thing worth paying attention to right now.
The Valuation Case Is Stacking Up. The Leverage Case Is Not.
MVRV landed at 1.23 in the latest read. Historically, readings at that level show up when holders across the network are barely sitting on gains. The market is not expensive at 1.23. It is closer to the opposite.
NUPL is at 0.19. Far from the zone where past cycle peaks were recorded. Stablecoin liquidity sitting on the sidelines is also large relative to Bitcoin supply at this point in the cycle. Idle capital. Waiting for something.
thechessONCHAIN, writing in CryptoQuant’s QuickTake published today, ran through every major signal. Most of them said the same thing. The leverage one did not, which is what made it worth writing about.
Why the Leverage Ratio Is High and Why That Might Not Mean What It Looks Like
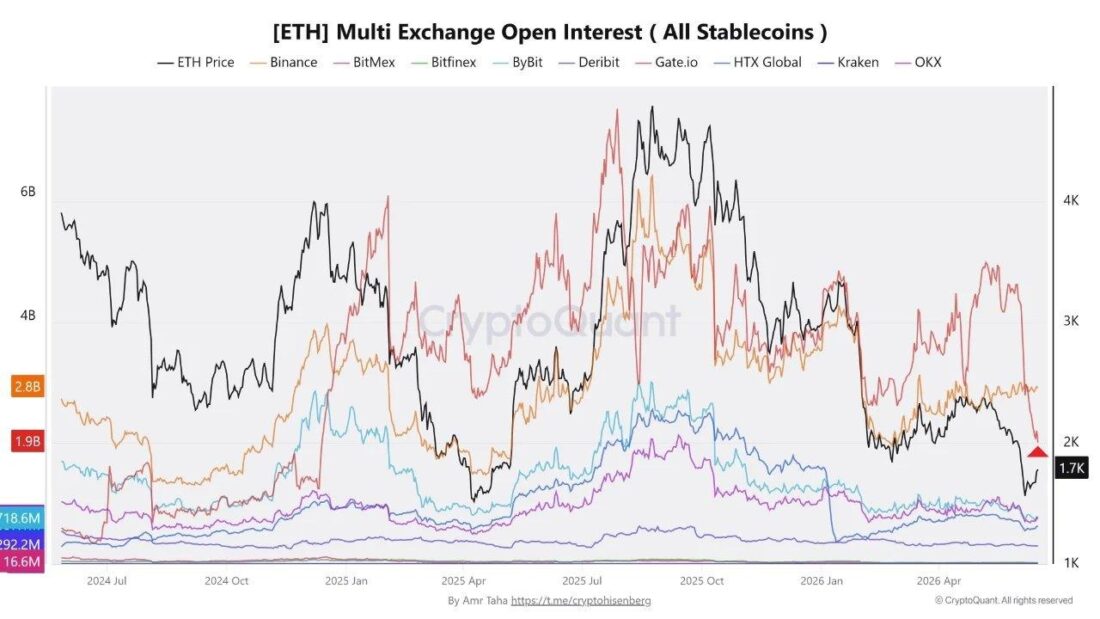
Source: CryptoQuant. ETH Multi Exchange Open Interest (All Stablecoins) by Amr Taha https://t.me/cryptohisenberg. Copyright CryptoQuant. All rights reserved.
The Estimated Leverage Ratio is at 0.247. Near the top of where it has traded this cycle. The thing is, exchange reserves are also near their cycle lows right now, which matters for how that ratio gets calculated.
Fewer coins on exchanges means fewer coins in the denominator. The ratio looks elevated partly for that reason, that is to say the math is amplifying it somewhat, not only because traders have been piling into fresh positions.
bitcoin on-chain data on funding rates is also telling a different story. They are slightly negative. Holding a leveraged long right now costs basically nothing or less. Not how a crowded euphoric trade normally feels.
This Setup Has Printed Twice Before. Both Times Bitcoin Went Up.
The specific combination of an ELR above 0.24 with MVRV below 1.30 has only come up twice before in this market cycle, once in February 2026 and once in March. Both instances, per the CryptoQuant analysis, resolved to the upside in the weeks that followed.
Two weeks after each instance, Bitcoin had gained somewhere in the 7% to 13% range. The four-week window was larger for both, though the exact spread varied. The short version is that neither episode turned into the liquidation cascade that high leverage usually implies.
Two episodes is not a pattern in any rigorous sense. thechessONCHAIN said as much. A tendency, not a rule. That framing matters.
One Number Will Tell You How This Resolves
If the ELR drops sharply at the same time price falls, the two-instance tendency breaks. That is the scenario where the leverage becomes the story, where forced liquidations start feeding on each other going down.
The 200-day moving average is sitting near $78,800. That level has not been reclaimed since the October collapse. Getting back above it is the cleaner sign that the cycle direction has actually turned.
If instead the ELR bleeds lower while price holds or climbs, the read flips. Per the June 16, 2026 CryptoQuant QuickTake, the ELR is the signal that determines which story this actually is.


Leave a Reply
You must be logged in to post a comment.