- ADA price started a fresh decline from the $1.40 resistance against the US Dollar.
- The price is now trading below $1.35 and the 55 simple moving average (4-hours).
- There is a key bearish trend line forming with resistance near $1.335 on the 4-hours chart (data feed via Bitfinex).
- The price might extend losses if there is a clear break below the $1.20 support.
Cardano price is struggling below the $1.40 resistance against the US Dollar, unlike bitcoin. ADA price must clear $1.35 to start a fresh increase.
Cardano Price Analysis
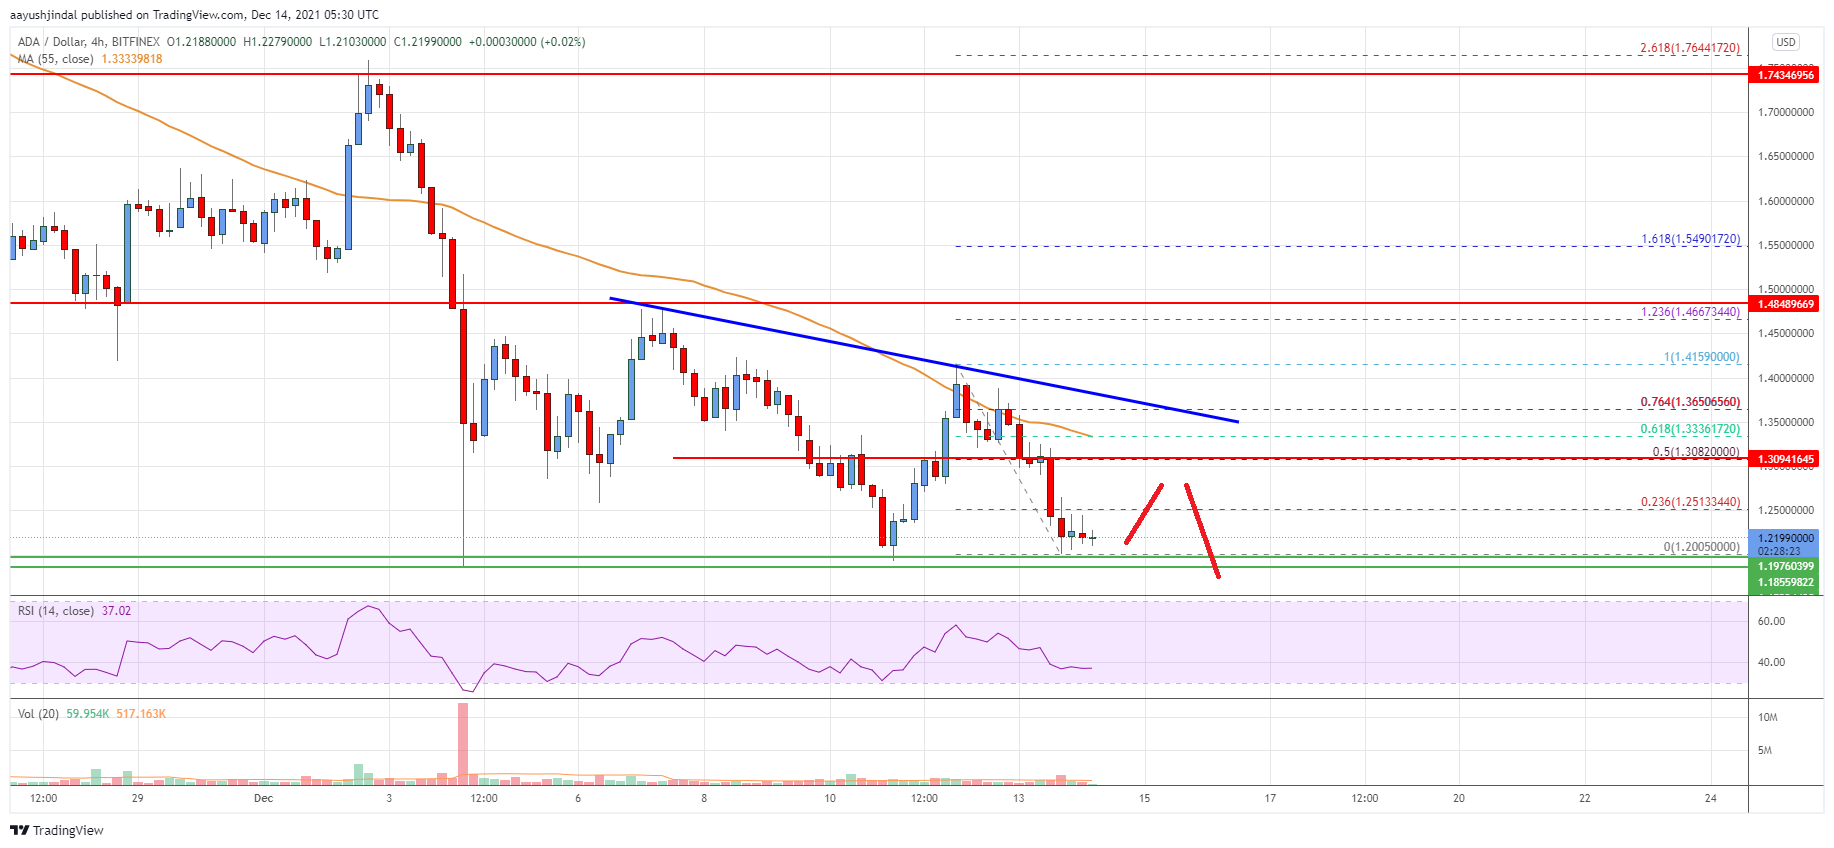
This week, cardano price saw a major decline below the $1.50 level against the US Dollar. The ADA/USD pair traded below the $1.35 support level to enter a bearish zone.
The bears gained strength for a move below the $1.30 level. The price even traded below the $1.25 level and settled below the 55 simple moving average (4-hours). A low was formed near $1.205 and the price is now consolidating losses.
It is facing resistance near the $1.25 level. It is close to the 23.6% Fib retracement level of the downward move from the $1.415 swing high to $1.200 low.
The next key resistance is near the $1.308 level. It is close to the 50% Fib retracement level of the downward move from the $1.415 swing high to $1.200 low. There is also a key bearish trend line forming with resistance near $1.335 on the 4-hours chart.
A clear break above the $1.335 resistance could pump the price towards the $1.35 level. Any more gains could push the price towards the $1.40 level.
On the downside, an immediate support is near the $1.205 level. The first major support is near $1.20. Any more losses might lead the price towards the $1.15 level, below which the bears could gain strength in the near term. In the stated case, the price could revisit $1.05.

The chart indicates that ADA price is now trading below $1.40 and the 55 simple moving average (4-hours). Overall, the price might might extend losses if there is a clear break below the $1.20 support.
Technical Indicators
4 hours MACD – The MACD for ADA/USD is moving in the bearish zone.
4 hours RSI – The RSI for ADA/USD is now below to the 50 level.
Key Support Levels – $1.20 and $1.15.
Key Resistance Levels – $1.308 and $1.350.


Leave a Reply
You must be logged in to post a comment.