- EOS price is slowly climbing higher and it recently broke the $3.000 resistance against the US Dollar.
- The price is currently correcting gains, but it remains supported near $3.050 and $3.000.
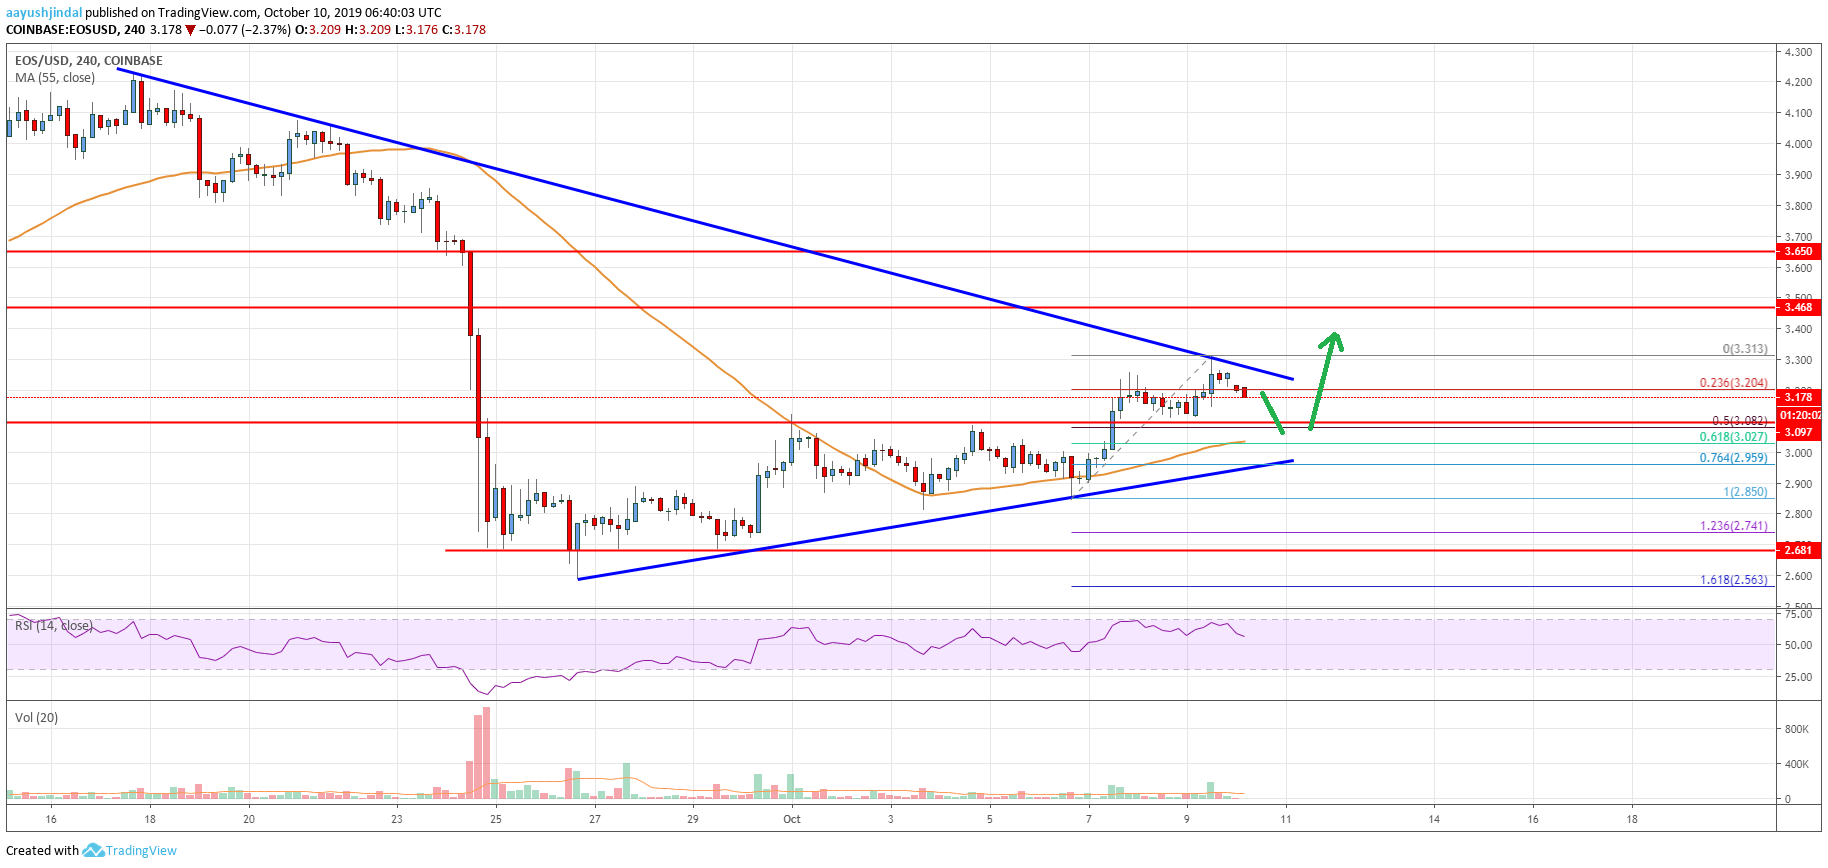
- There is a crucial bearish trend line forming with resistance near $3.280 on the 4-hours chart of the EOS/USD pair (data feed from Coinbase).
- The pair could rise steadily once there is a clear break above the $3.300 resistance area.
EOS price is trading with a positive bias against the US Dollar and bitcoin. The price is likely to recover towards the $3.450 and $3.650 resistance levels in the near term.
EOS Price Analysis
This past week, there was a downside extension in bitcoin, Ethereum, ripple, litecoin and EOS against the US Dollar. However, the market recovered this week and EOS price started a decent upward move from the $2.850 support area. It surpassed the key $3.000 resistance area. Moreover, there was a close above the $3.080 resistance area and the 55 simple moving average (4-hours).
As a result, there were further gains and the price traded to a new monthly low near $3.313. At the moment, the price is correcting gains below the $3.200 level. Moreover, it traded below the 23.6% Fib retracement level of the recent wave from the $2.850 low to $3.313 high. On the downside, there is a strong support forming near the $3.080 and $3.050 levels.
Additionally, the 50% Fib retracement level of the recent wave from the $2.850 low to $3.313 high is also near the $3.080 level. Therefore, dips towards the $3.080 level remains well supported. If there are further downsides, the price could test the $3.000 support area or the 55 SMA. There is also a connecting bullish trend line forming with support near $3.000 on the 4-hours chart of the EOS/USD pair.
On the upside, there is a key resistance forming near the $3.300 level. Additionally, there is a crucial bearish trend line forming with resistance near $3.280 on the same chart. A successful break above the trend line and $3.300 could set the pace for more gains. The next resistance is near the $3.450 level, above which the price could test the key $3.650 resistance.
Looking at the chart, EOS price is showing a lot of positive signs above the $3.080 and $3.000 support levels. As long as there is no close below $3.000, there are high chances of more gains above $3.300 and $3.450.
Technical indicators
Hourly MACD – The MACD for EOS/USD is losing momentum in the bullish zone.
Hourly RSI (Relative Strength Index) – The RSI is currently correcting lower towards the 50 level.
Major Support Levels – $3.080 and $3.000.
Major Resistance Levels – $3.300 and $3.450.