
- Litecoin price failed to clear the $188-$190 resistance zone against the US Dollar.
- LTC price is now trading below $170 and the 55 simple moving average (4-hours).
- There was a break below a key bullish trend line with support near $176 on the 4-hours chart of the LTC/USD pair (data feed from Coinbase).
- The pair must stay above the $155 support to avoid more downsides in the near term.
Litecoin price is correcting gains from $190 against the US Dollar, similar to bitcoin. LTC price could continue lower if it fails to stay above the $155 support zone.
Litecoin Price Analysis
This week, there was a downside correction in bitcoin, ethereum, ripple, and litecoin against the US Dollar. Earlier, LTC extended its increase above the $170 level.
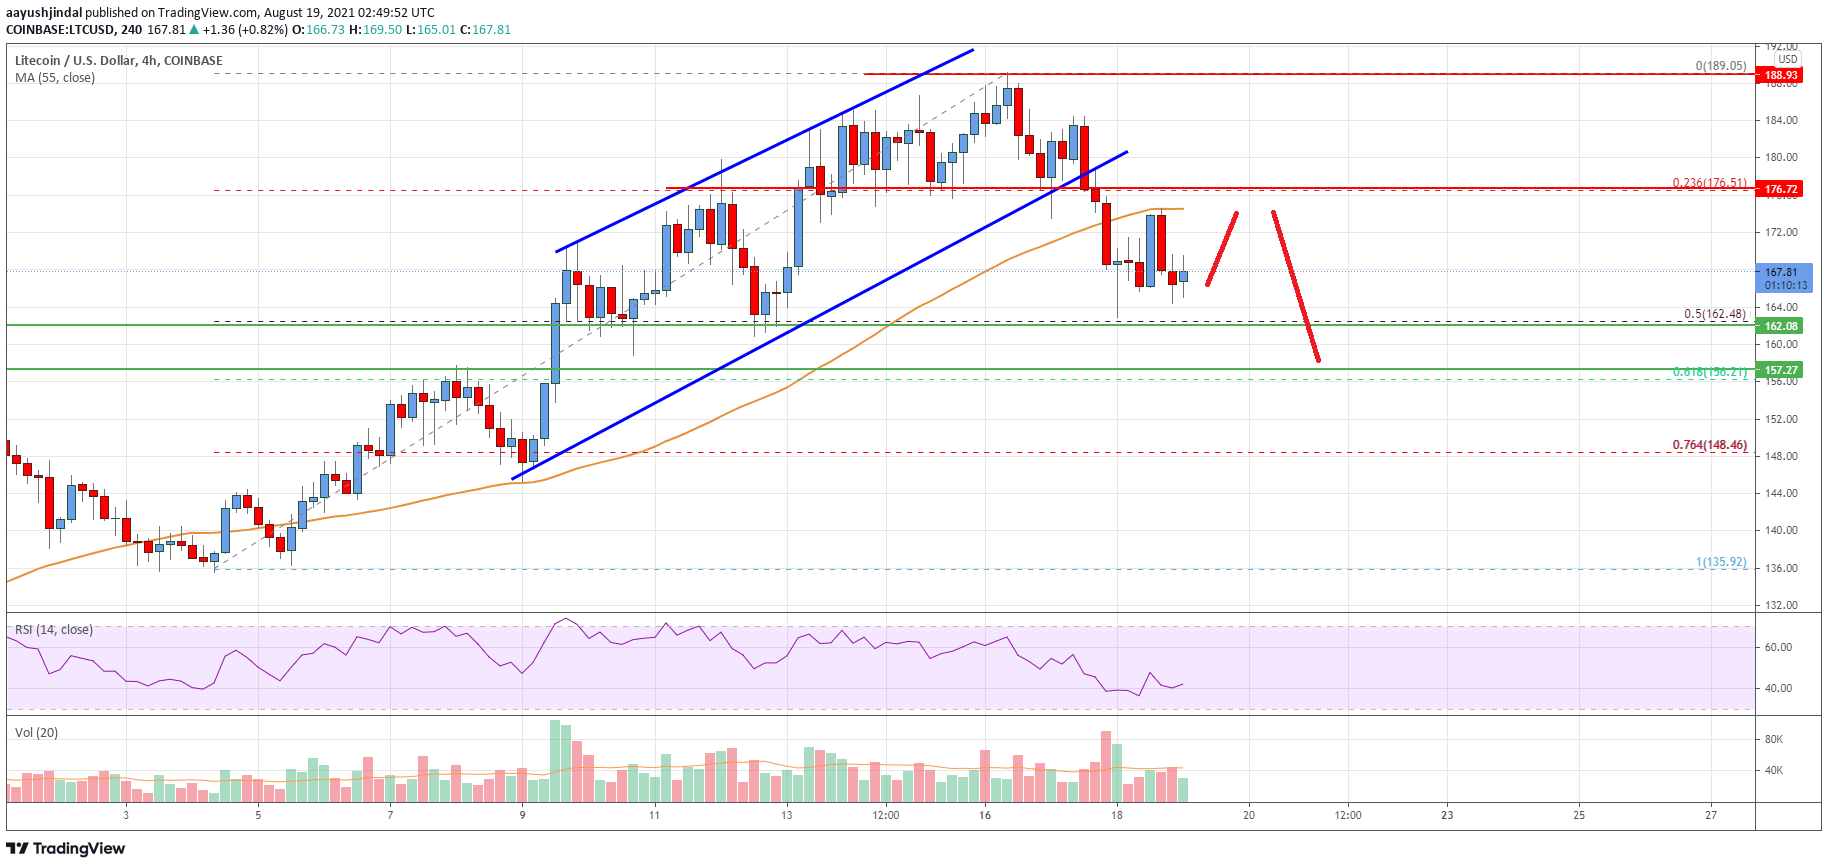
The price surpassed the $180 resistance level and the 55 simple moving average (4-hours). It even cleared the $185 resistance level. However, the price failed to clear the $188-$190 resistance zone. A high was formed near $189 and recently there was a downside correction.
The price traded below the $172 and $170 support levels. There was a break below 23.6% Fib retracement level of the upward move from the $135 swing low to $189 high.
There was also a break below a key bullish trend line with support near $176 on the 4-hours chart of the LTC/USD pair. The pair is now trading below $170 and the 55 simple moving average (4-hours). An immediate support is near the $162 level.
The 50% Fib retracement level of the upward move from the $135 swing low to $189 high is also near the $162 level. The next key support is near the $155 level, below which there is a risk of a move towards the $125 level.
On the upside, the price must clear $172 and the 55 simple moving average (4-hours) for more gains. The next key resistance could be $188. Any more gains could set the pace for a move towards the main $200 resistance in the near term.
Looking at the chart, litecoin price is clearly trading below $170 and the 55 simple moving average (4-hours). Overall, the price must stay above the $155 support to avoid more downsides in the near term.
Technical indicators
4 hours MACD – The MACD for LTC/USD is now gaining pace in the bearish zone.
4 hours RSI (Relative Strength Index) – The RSI for LTC/USD is now below the 50 level.
Key Support Levels – $162 and $155
Key Resistance Levels – $175 and $188.


Leave a Reply
You must be logged in to post a comment.