- Litecoin price started a sharp downside correction from the $250 resistance against the US Dollar.
- LTC price is now trading well below $200 and the 55 simple moving average (4-hours).
- There is a key contracting triangle forming with resistance near $188 on the 4-hours chart of the LTC/USD pair (data feed from Coinbase).
- The pair must clear the $190 and $200 resistance level for more upsides in the near term.
Litecoin price is consolidating losses below $200 against the US Dollar, while bitcoin is above $50K. LTC price must settle above $200 to avoid another decline in the near term.
Litecoin Price Analysis
Recently, there was a sharp decline in bitcoin, Ethereum, ripple, and litecoin against the US Dollar. Earlier, LTC extended its gains above the $220 and $235 resistance levels.
However, the price failed to clear the $250 resistance and started a sharp decline. There was a break below the $220 support level. There was also a break below a major bullish trend line with support near $220 on the 4-hours chart of the LTC/USD pair.
It opened the doors for more losses below $200 and the 55 simple moving average (4-hours). The price even declined below the $180 support and tested $160.
A low is formed near $158 and the price is currently correcting higher. It broke the 23.6% Fib retracement level of the recent decline from the $250 swing high to $158 low. It seems like there is a key contracting triangle forming with resistance near $188 on the same chart.
The next major resistance is near the $200 zone. The 50% Fib retracement level of the recent decline from the $250 swing high to $158 low is also near $202.
To move back into a positive zone, the price must clear the $200 resistance zone. The next key resistance is near the $220 level. Conversely, there is a risk of another decline below the $175 and $170 levels. The main support is near $160, below which the price might test $150.
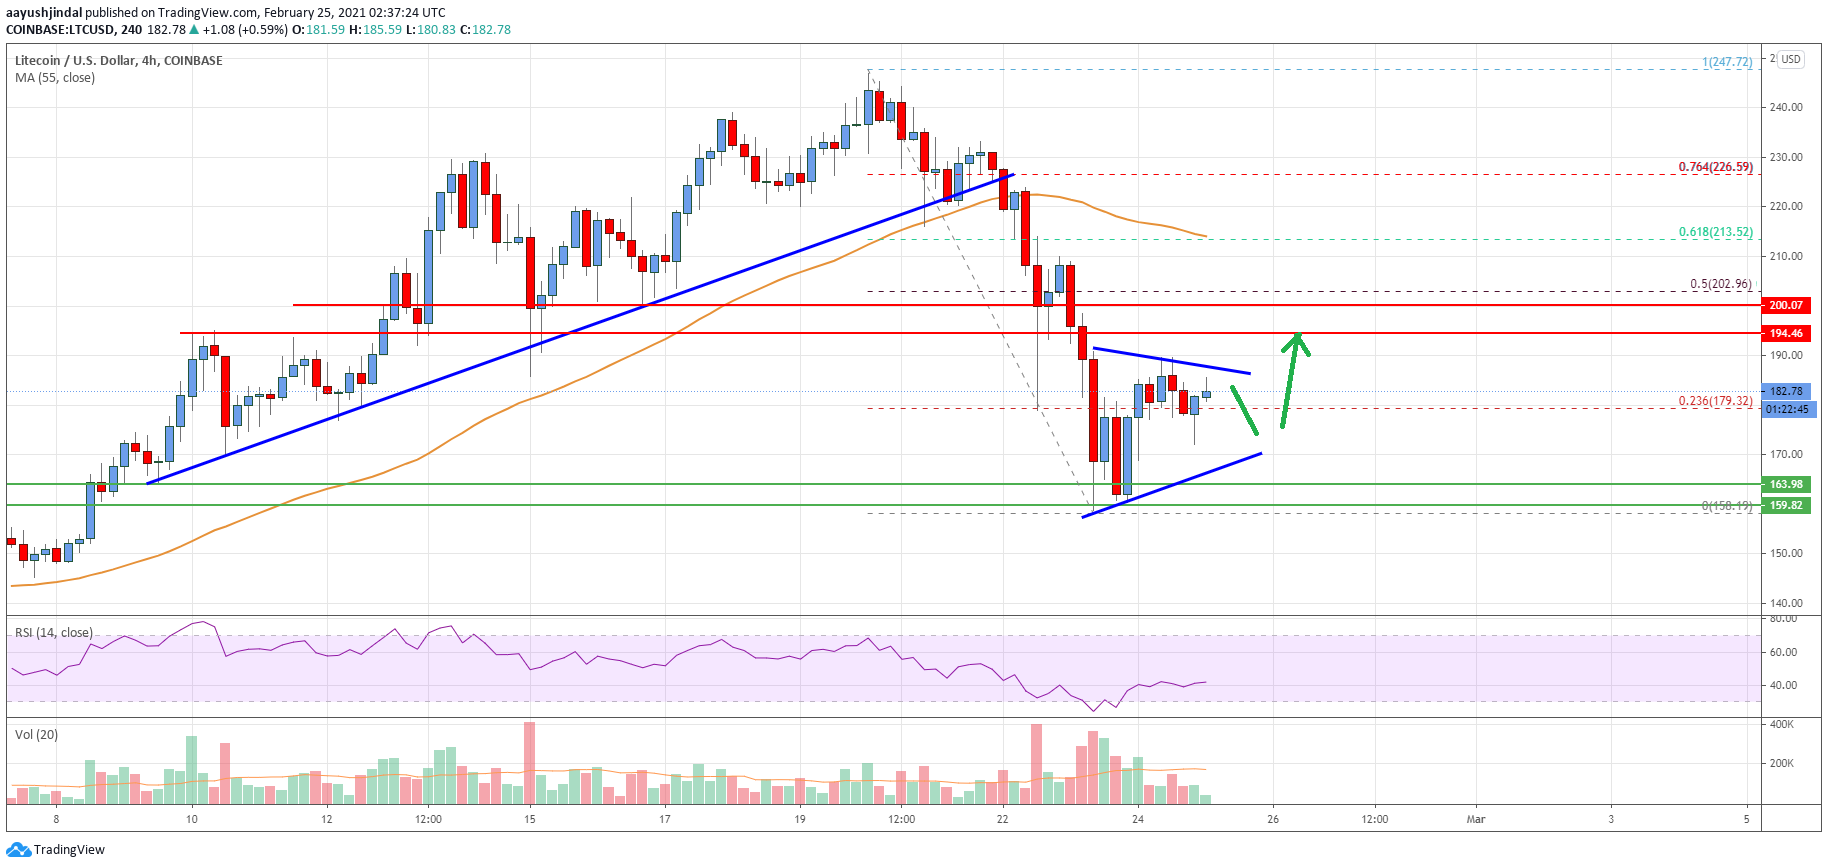
Looking at the chart, litecoin price is now trading well below $200 and the 55 simple moving average (4-hours). Overall, the price must clear the $190 and $200 resistance level for more upsides in the near term.
Technical indicators
4 hours MACD – The MACD for LTC/USD is currently struggling to gain pace in the bullish zone.
4 hours RSI (Relative Strength Index) – The RSI for LTC/USD is still well below the 50 level.
Key Support Levels – $170 and $160.
Key Resistance Levels – $190 and $200.