- Litecoin price declined sharply below $350 and $300 against the US Dollar.
- LTC price is now trading well below the $250 level and the 55 simple moving average (4-hours).
- There is a crucial bearish trend line forming with resistance near $255 on the 4-hours chart of the LTC/USD pair (data feed from Coinbase).
- The pair is correcting losses, but it is likely to face sellers near $220 and $250.
Litecoin price is correcting losses from the $145 support zone against the US Dollar, similar to bitcoin. LTC price could resume its decline if it fails to clear $250.
Litecoin Price Analysis
Recently, there was a sharp decline in bitcoin, ethereum, ripple, and litecoin against the US Dollar. Earlier, LTC struggled to stay above the $350 and $320 support levels.
As a result, there was a sharp decline below the $300 support level. The price even dived below the $250 support level and the 55 simple moving average (4-hours). Finally, the price spiked below the $200 level and a low is formed near the $145 level.
There was a decent recovery wave above the $160 and $180 levels. The price corrected above the 23.6% Fib retracement level of the recent decline from the $321 swing high to $145 low.
However, the price is struggling to clear the $220 resistance zone. It seems like the bulls are facing hurdles near a broken channel support at $210. The 50% Fib retracement level of the recent decline from the $321 swing high to $145 low is also acting as a resistance.
Moreover, there is a crucial bearish trend line forming with resistance near $255 on the 4-hours chart of the LTC/USD pair. A successful break above the $250 level is must to move back into a positive zone. The next major resistance could be near the $300 level.
If there is no upside break, the price could start a fresh decline. An initial support on the downside is near the $185 level. The next major support could be near the $150 zone. Any more losses might call for a drop towards the $120 level.
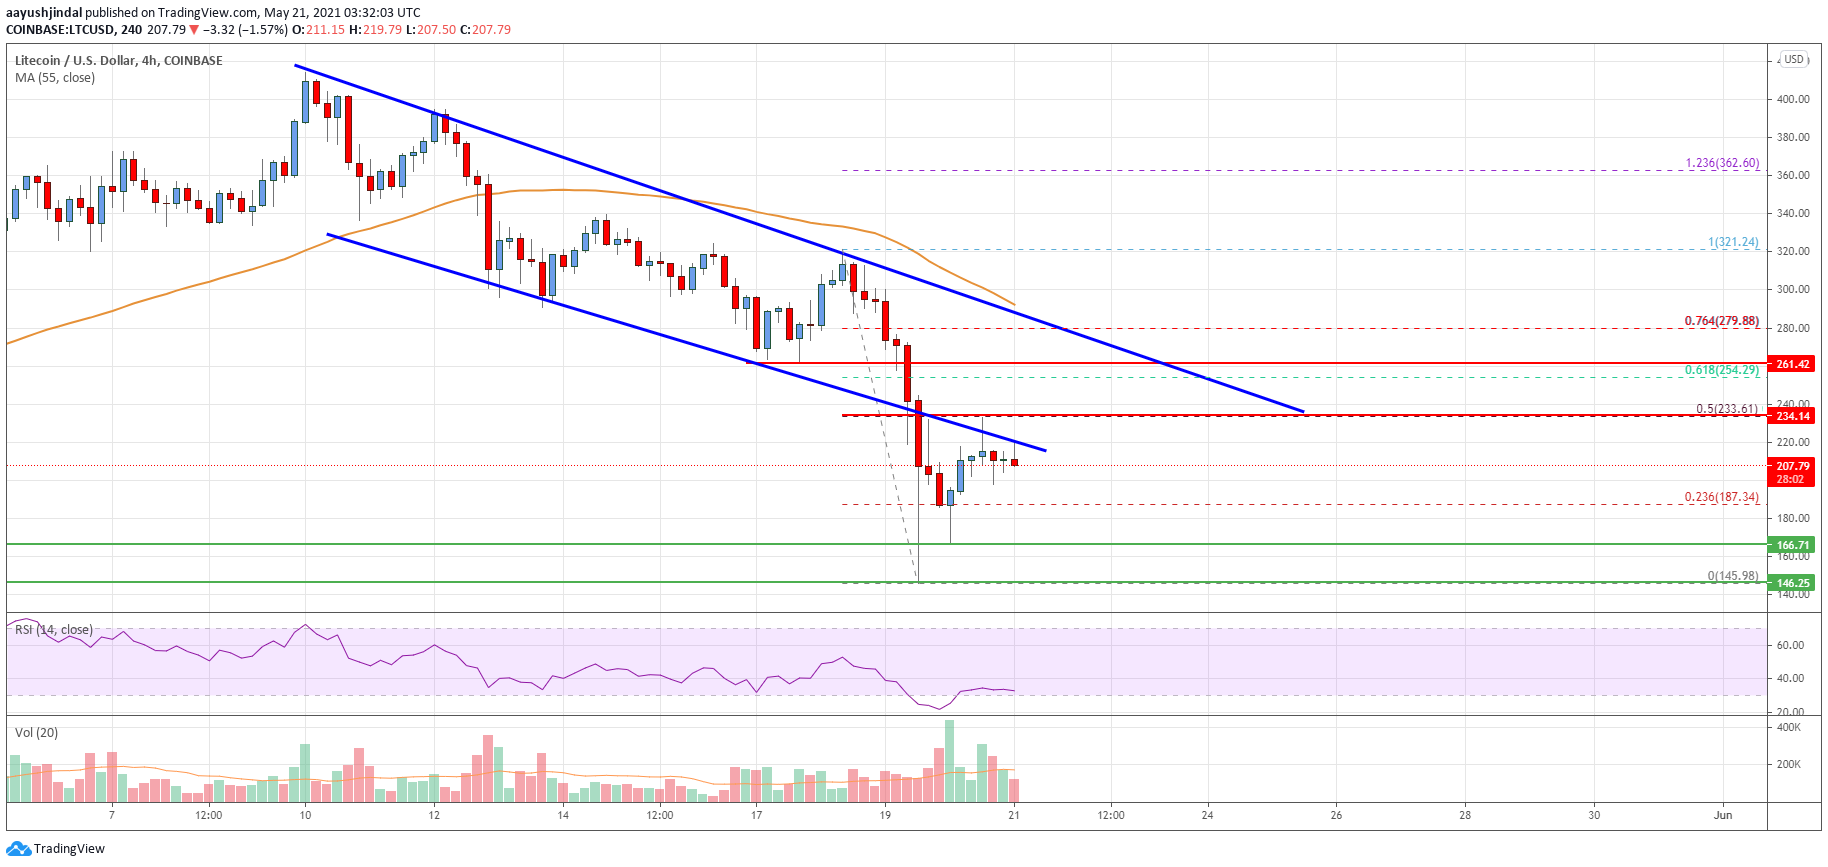
Looking at the chart, litecoin price is now trading well below $250 and the 55 simple moving average (4-hours). Overall, the price is correcting losses, but it is likely to face sellers near $220 and $250.
Technical indicators
4 hours MACD – The MACD for LTC/USD is slowly losing pace in the bullish zone.
4 hours RSI (Relative Strength Index) – The RSI for LTC/USD is now well below the 50 level.
Key Support Levels – $185 and $150.
Key Resistance Levels – $220 and $250.
