- Litecoin price start a fresh decline after it failed to break the $75.00 resistance against the US Dollar.
- LTC price is currently trading well below the main $70.80 and $70.00 support levels.
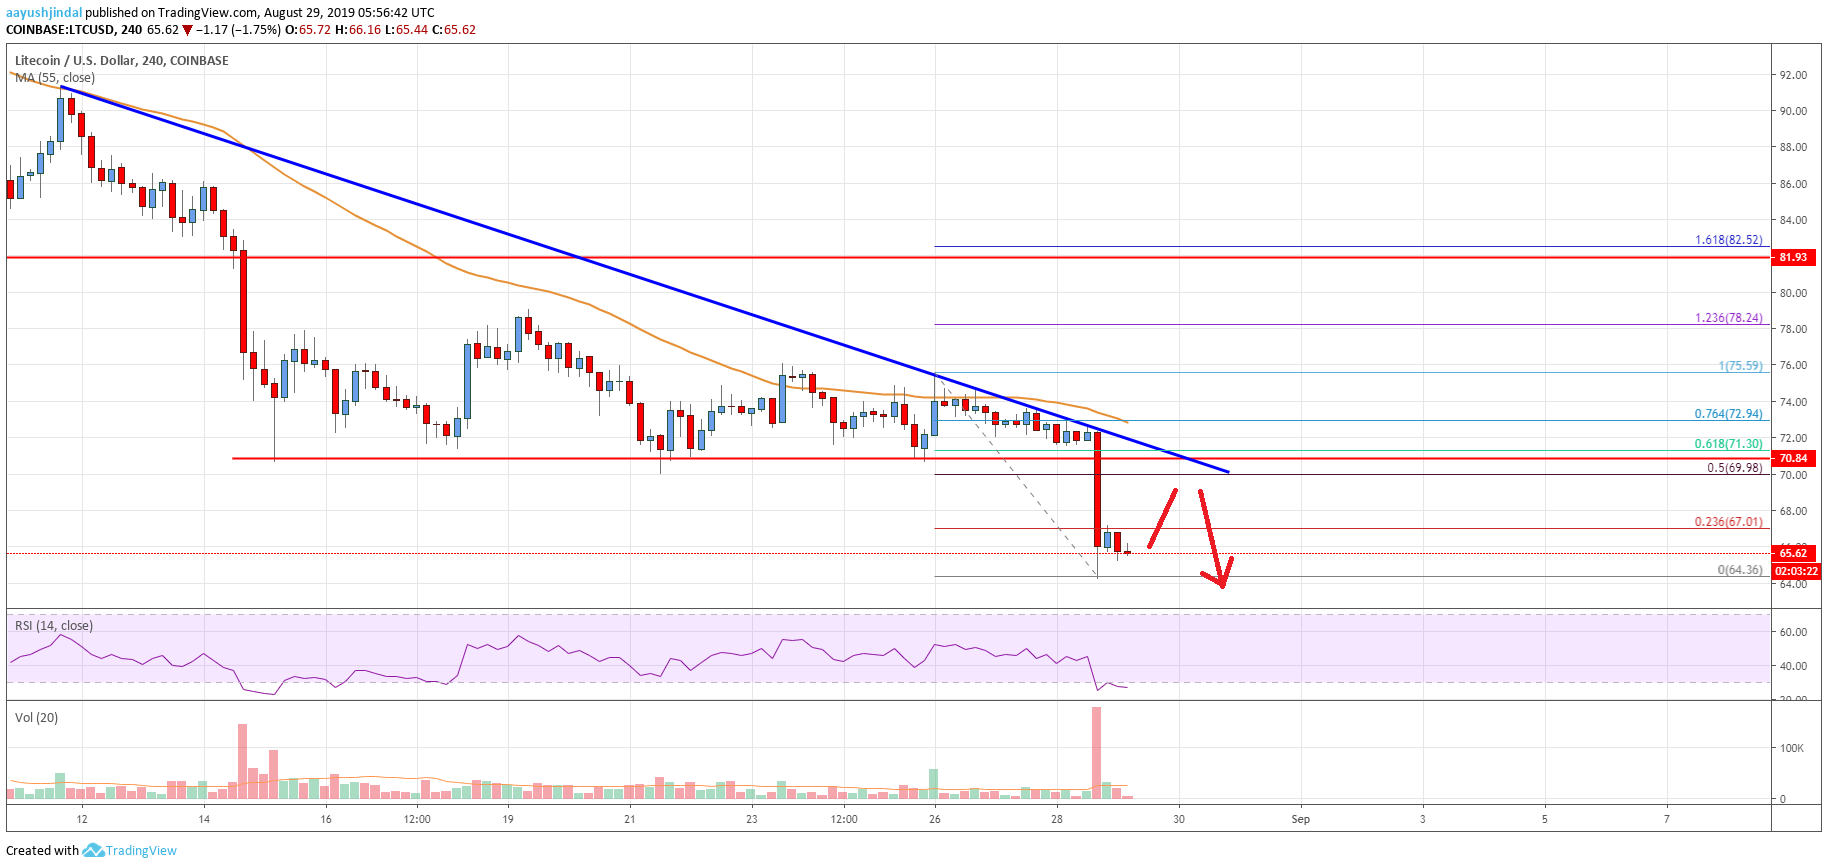
- There is a crucial bearish trend line forming with resistance near $70.00 on the 4-hours chart of the LTC/USD pair (data feed from Coinbase).
- The pair remains at a risk of more downsides and upsides could be capped near $70.00.
Litecoin price is facing an increase in selling pressure against the US Dollar and bitcoin. LTC is likely to extend its decline towards or below $60.00 in the coming sessions.
Litecoin Price Analysis
Earlier this week, litecoin price made an attempt to surpass the $75.00 and $76.00 resistances against the US Dollar. However, the LTC/USD pair failed to continue higher and recently started a fresh decline below the $72.00 support. Moreover, there was a break below the key $70.80 and $70.00 support levels. Finally, there was a close below the $70.00 level and the 55 simple moving average (4-hours).
The price traded as low as $64.36 and it is currently consolidating losses. An immediate resistance is near the $67.00 level. It represents the 23.6% Fib retracement level of the recent decline from the $75.99 high to $64.36 low. However, the main resistances on the upside are near the $69.00 and $70.00 levels (the previous support levels).
Additionally, the 50% Fib retracement level of the recent decline from the $75.99 high to $64.36 low is near the $69.98 level to act as a resistance. More importantly, there is a crucial bearish trend line forming with resistance near $70.00 on the 4-hours chart of the LTC/USD pair. Therefore, an upside correction towards the $69.00 and $70.00 resistance levels is likely to face a strong selling interest.
On the downside, an immediate support is near the $64.40 level. If there is a downside break below the $64.40 support, the price could continue to move down towards the $60.00 support area. Any further downsides could start a strong decline towards the $55.00 support.

Looking at the chart, litecoin price is clearly trading in a bearish zone below the $69.00 and $70.00 resistance levels. In the short term, there could be an upside correction towards the $68.00 or $69.00 level. However, sellers are likely to defend the upward move above $70.00. On the downside, they are likely to aim the $60.00 support area.
Technical indicators
4 hours MACD – The MACD for LTC/USD is currently gaining momentum in the bearish zone.
4 hours RSI (Relative Strength Index) – The RSI for LTC/USD is currently well below the 30 level.
Key Support Levels – $64.40 and $60.00.
Key Resistance Levels – $69.00 and $70.00.


Leave a Reply
You must be logged in to post a comment.