- Litecoin price declined heavily below the $85.00 and $80.00 supports against the US Dollar.
- LTC price is currently under a lot of pressure and it could even decline below the $70.00 support.
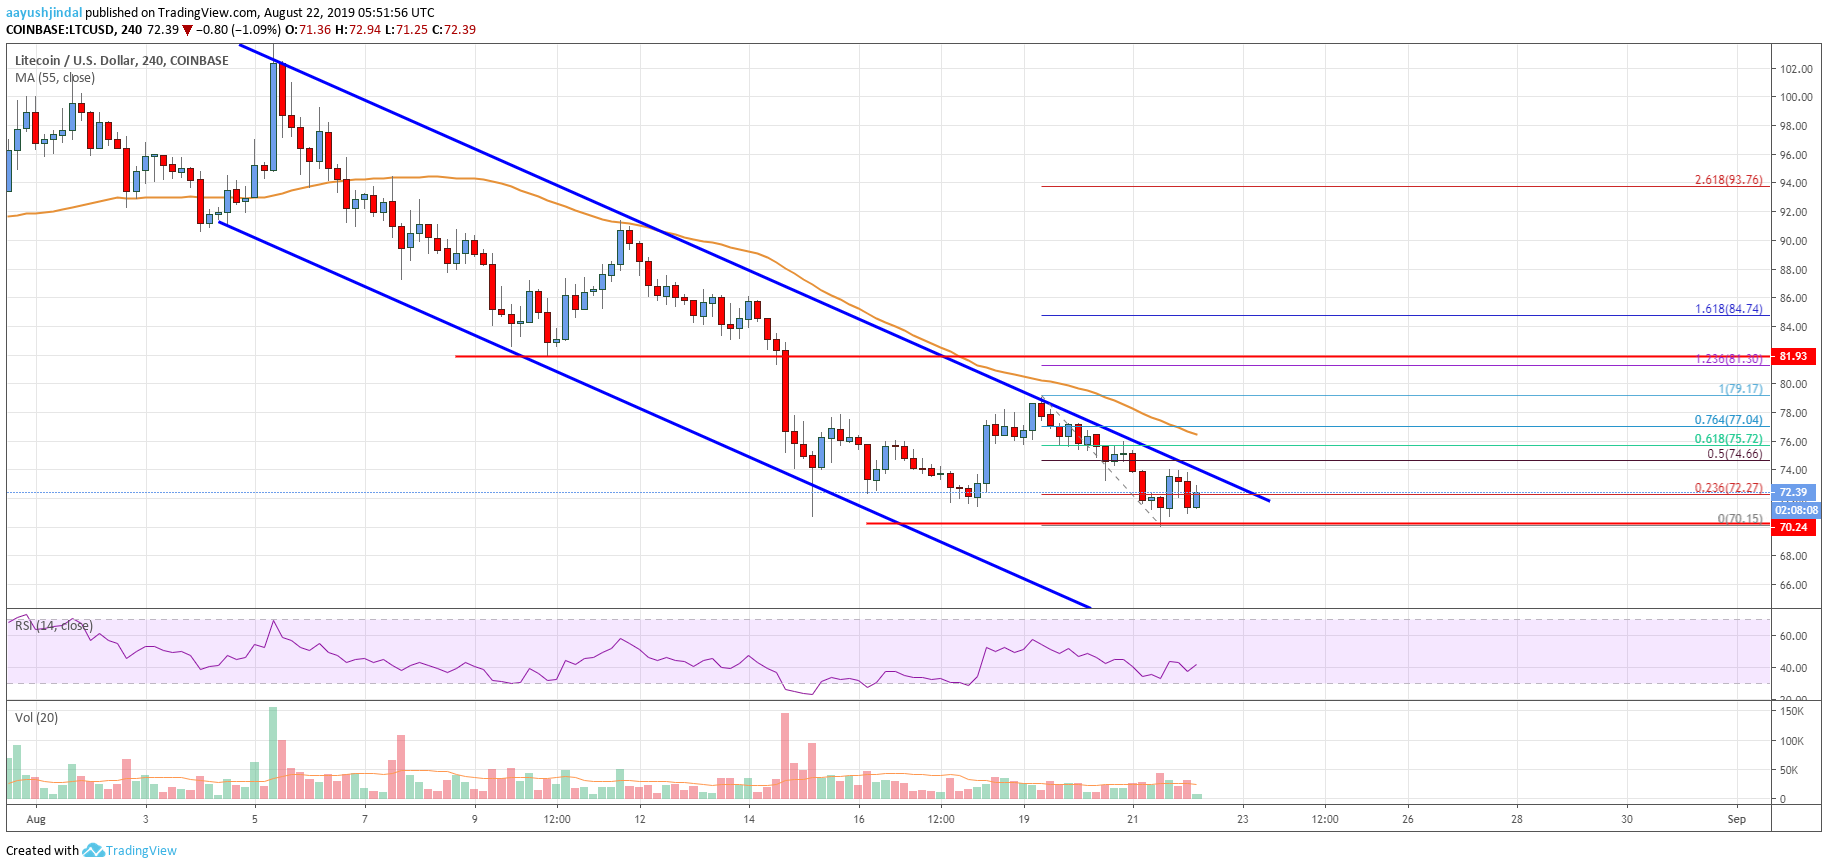
- There is a significant declining channel forming with resistance near $74.00 on the 4-hours chart of the LTC/USD pair (data feed from Coinbase).
- The pair could correct higher if there is a recovery above the $75.00 and $80.00 resistances.
Litecoin price is trading in a major downtrend against the US Dollar and bitcoin. LTC is likely to decline heavily if it breaks the $70.00 support level in the near term.
Litecoin Price Analysis
In the past two weeks, litecoin price declined steadily from well above the $90.00 level against the US Dollar. The LTC/USD pair broke many important supports near the $85.00 and $80.00 levels. Moreover, there was a close below the $80.00 level and the 55 simple moving average (4-hours). The price even broke the $75.00 support and it recently traded to a new monthly low at $70.15.
It is currently consolidating losses above the $70.00 support. An immediate resistance is near the $74.00 level plus the 50% Fib retracement level of the recent drop from the $79.17 high to $70.15 low. Moreover, there is a significant declining channel forming with resistance near $74.00 on the 4-hours chart of the LTC/USD pair. Above the channel resistance, the next resistance is near the $76.00 level.
The 61.8% Fib retracement level of the recent drop from the $79.17 high to $70.15 low might also act as a resistance. Additionally, the 55 simple moving average (4-hours) is near the $77.00 level to prevent gains. The main resistance on the upside is near the $80.00 zone, where litecoin bulls are likely to struggle if the price corrects higher. On the downside, the main support is near the $70.00 level.
If the price slides below $70.00, it could spark heavy bearish moves. The next stop for the bears may perhaps be $65.00 or $62.00. If the bears remain in action, the price might even test the $60.00 level.
Looking at the chart, litecoin price is clearly trading in a major downtrend below $75.00 and $80.00. To start a strong upward move, the price must break $75.00, the 55 SMA, and $80.00. If not, it is likely to continue its decline below the $70.00 support level. The next stop could be near $60.00.
Technical indicators
4 hours MACD – The MACD for LTC/USD is currently gaining pace in the bearish zone.
4 hours RSI (Relative Strength Index) – The RSI for LTC/USD is currently correcting towards the 50 level.
Key Support Levels – $70.00 and $65.00.
Key Resistance Levels – $75.00 and $80.00.