
- Litecoin price started a strong decline after it failed to climb above $90.0 against the US Dollar.
- LTC price is currently trading well below the $82.00 support and remains at a risk of more losses.
- There is a crucial declining channel forming with resistance near $82.00 on the 4-hours chart of the LTC/USD pair (data feed from Coinbase).
- The pair is likely to accelerate its decline if there is a downside break below $72.00 and $70.00.
Litecoin price is facing a strong selling interest against the US Dollar and bitcoin. LTC price could continue to slide below the $70.00 support in the near term.
Litecoin Price Analysis
Recently, litecoin price made an attempt to surpass the $90.00 resistance against the US Dollar. The LTC/USD pair failed to gain pace above the $88.00 and $90.00 levels. A swing high was formed near $86.05 and the price started a strong decline. There was a break below the key $82.00 support level to enter a bearish zone. Moreover, there was a close below the $80.00 level and the 55 simple moving average (4-hours).
The price traded as low as $73.99 recently and is currently trading with a bearish angle. An immediate resistance is near the $76.50 level plus the 23.6% Fib retracement level of the recent drop from the $86.05 high to $73.99 low. If there is an upside correction, the price could face resistance near the $80.00 level. Moreover, the 50% Fib retracement level of the recent drop from the $86.05 high to $73.99 low is also near $80.00.
More importantly, there is a crucial declining channel forming with resistance near $82.00 on the 4-hours chart of the LTC/USD pair. The channel resistance is near the 61.8% Fib retracement level of the recent drop from the $86.05 high to $73.99 low. Therefore, the $80.00 and $82.00 levels are likely to act as strong sell zones in the coming sessions.
On the downside, an initial support is near the $72.00 level. If there are more downsides, the price could even break the $70.00 support and accelerate losses in the near term. The next stop for the bearish may perhaps be near the $66.00 level.
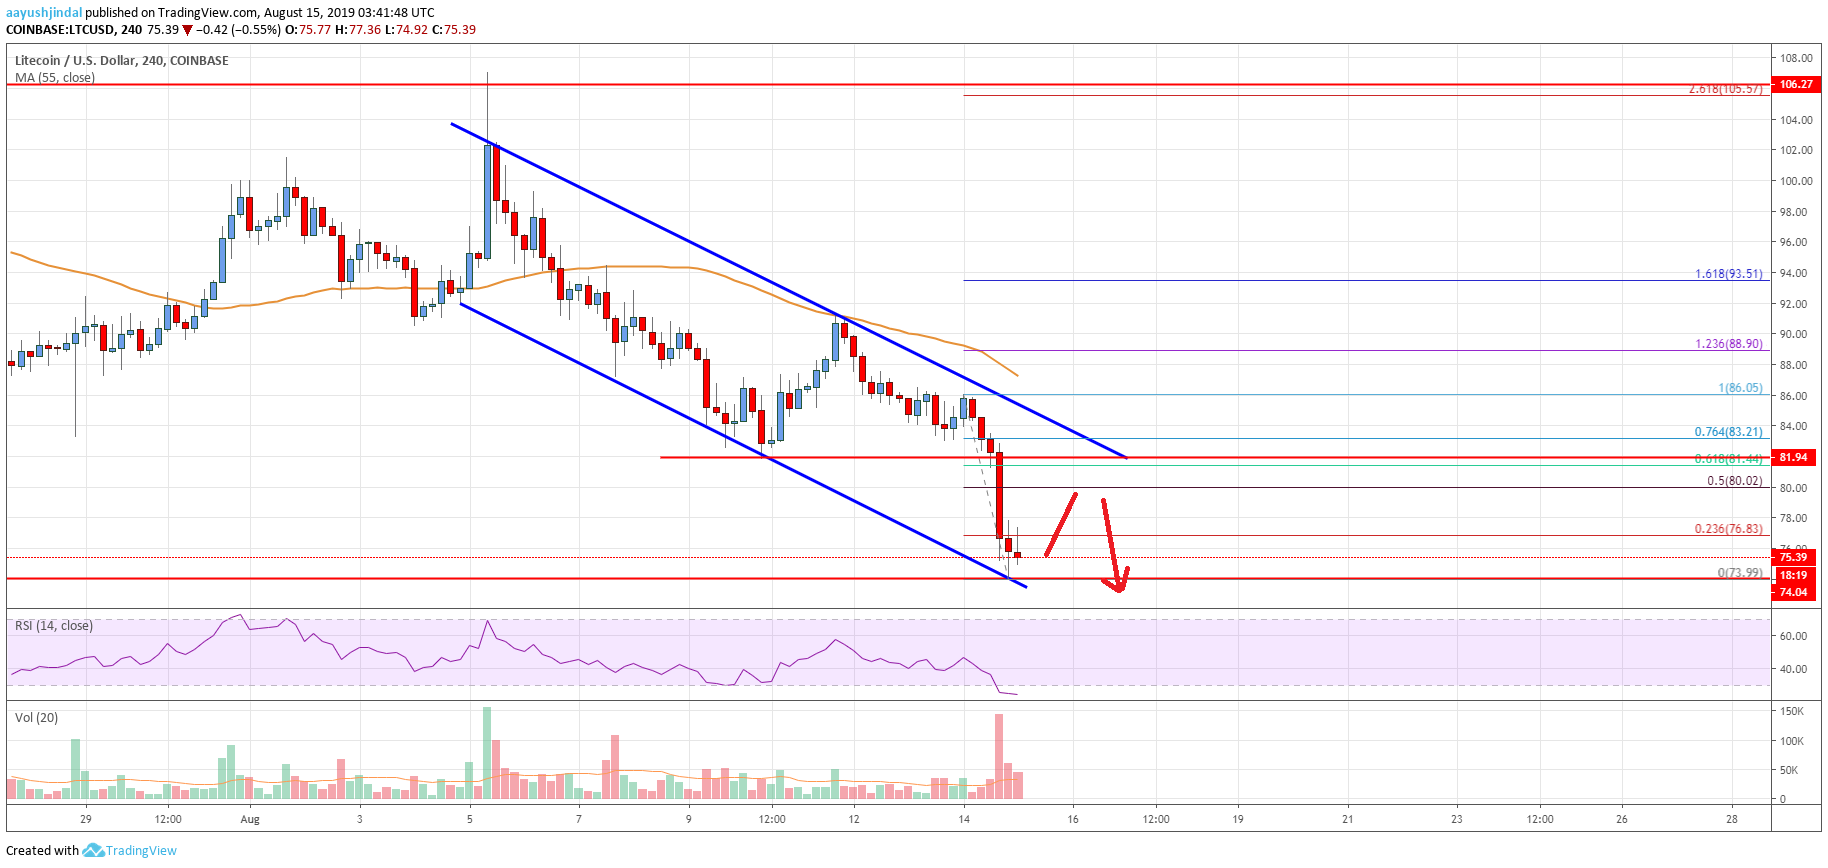
Looking at the chart, litecoin price is clearly trading in a bearish zone below the $82.00 and $80.00 levels. As long as the price is below the $82.00 pivot level, there is a risk of more downsides towards $70.00 and $66.00.
Technical indicators
4 hours MACD – The MACD for LTC/USD is currently gaining momentum in the bearish zone.
4 hours RSI (Relative Strength Index) – The RSI for LTC/USD is now well below the 30 level.
Key Support Levels – $72.00 and $70.00.
Key Resistance Levels – $80.00 and $82.00.


Leave a Reply
You must be logged in to post a comment.